mlframe reporting chart gallery
Every chart / diagnostic in the mlframe reporting subsystem, rendered to PNG on synthetic
data chosen to make each chart meaningful. Regenerate with python scripts/render_gallery.py.
Total images: 48 across 27 categories.
Contents
- regression
- binary
- risk_coverage
- model_card
- multiclass
- multilabel
- ltr
- quantile
- drift
- calibration_drift
- error_analysis
- prediction_stability
- slice_finder
- fairness_calibration
- calibration_by_feature
- calibration_heatmap_2d
- pdp_ice
- pdp_2d
- model_comparison
- split_comparison
- training_curve
- learning_curve
- temporal
- fs_benchmark
- shap_panels
- shap_interactions
- shap_per_instance
regression
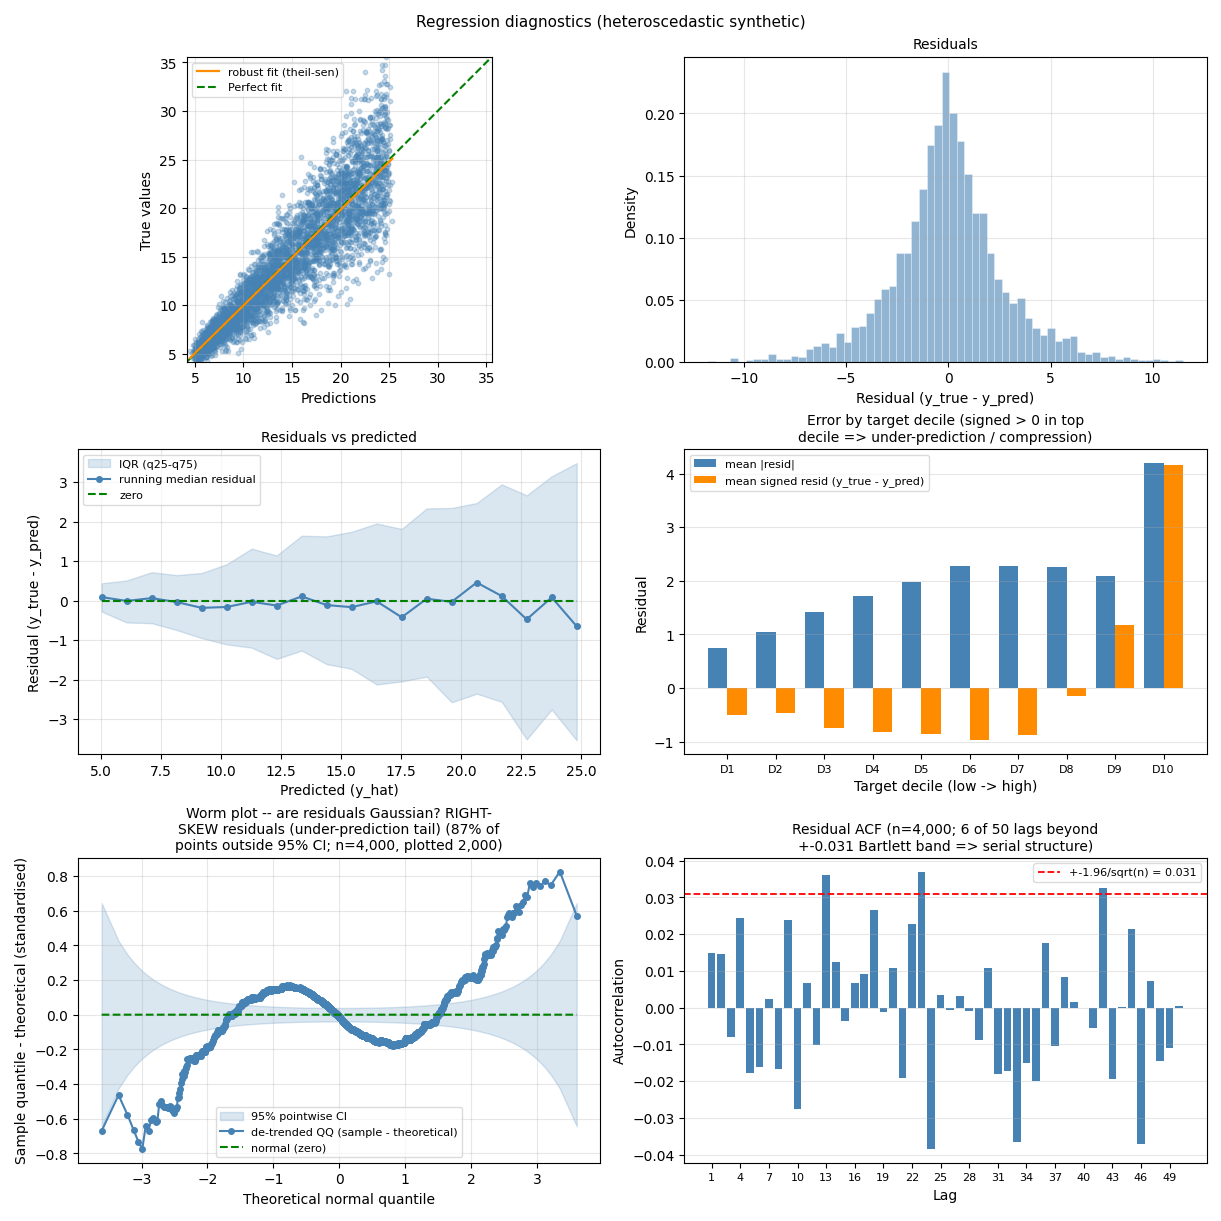
regression_full
Pred-vs-actual scatter, residual hist, residual-vs-pred, error-by-decile, worm, residual ACF.
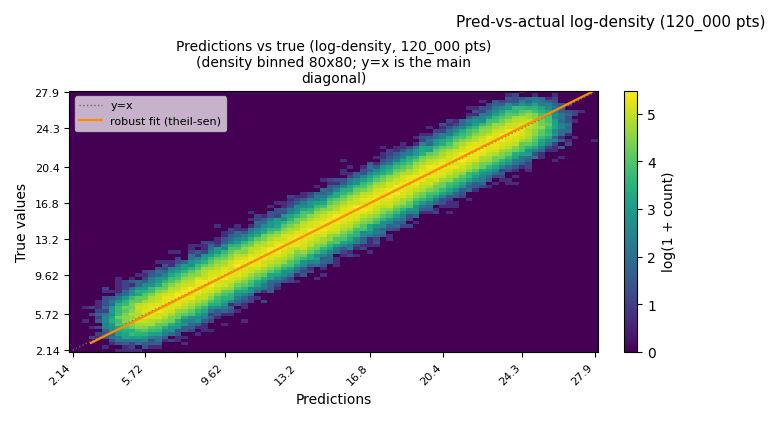
regression_hexbin_largen
Large-n (>50k) pred-vs-actual drawn as a log-density 2-D histogram instead of a point cloud.
binary
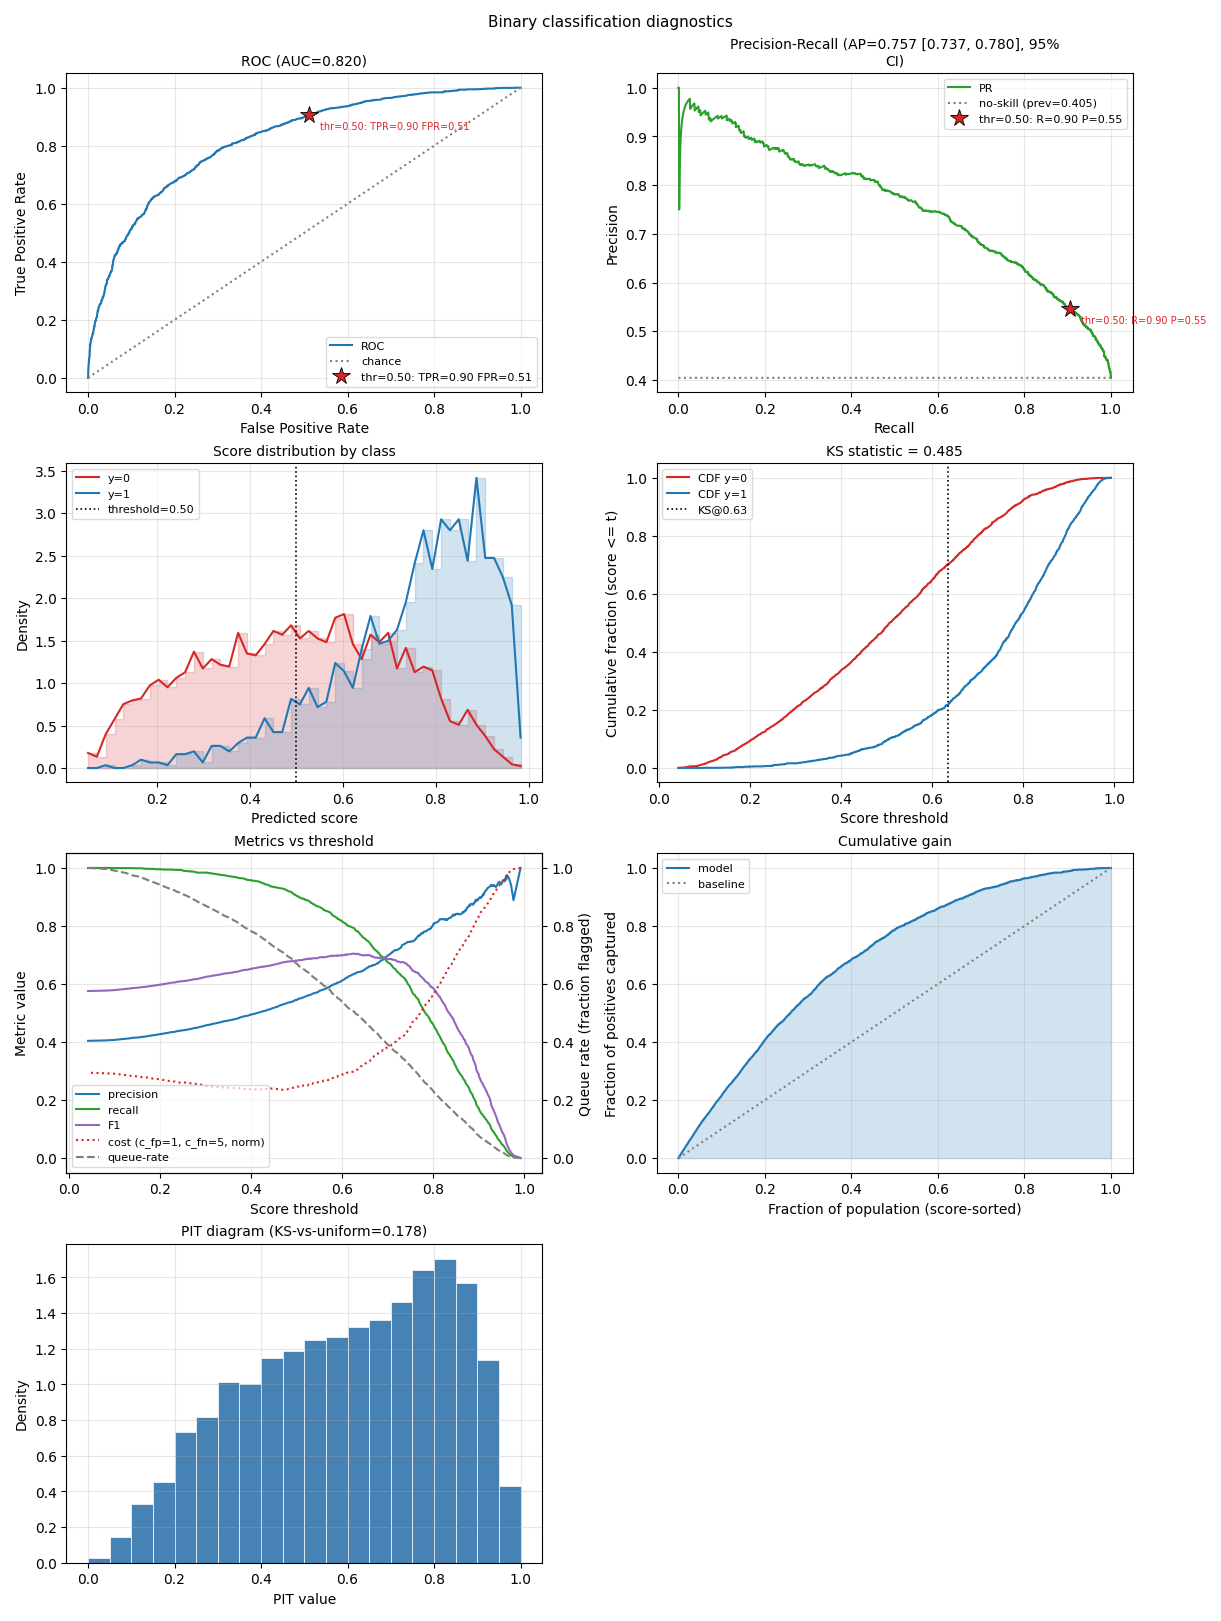
binary_full
ROC, PR, score distribution, KS, threshold sweep, gain, PIT.
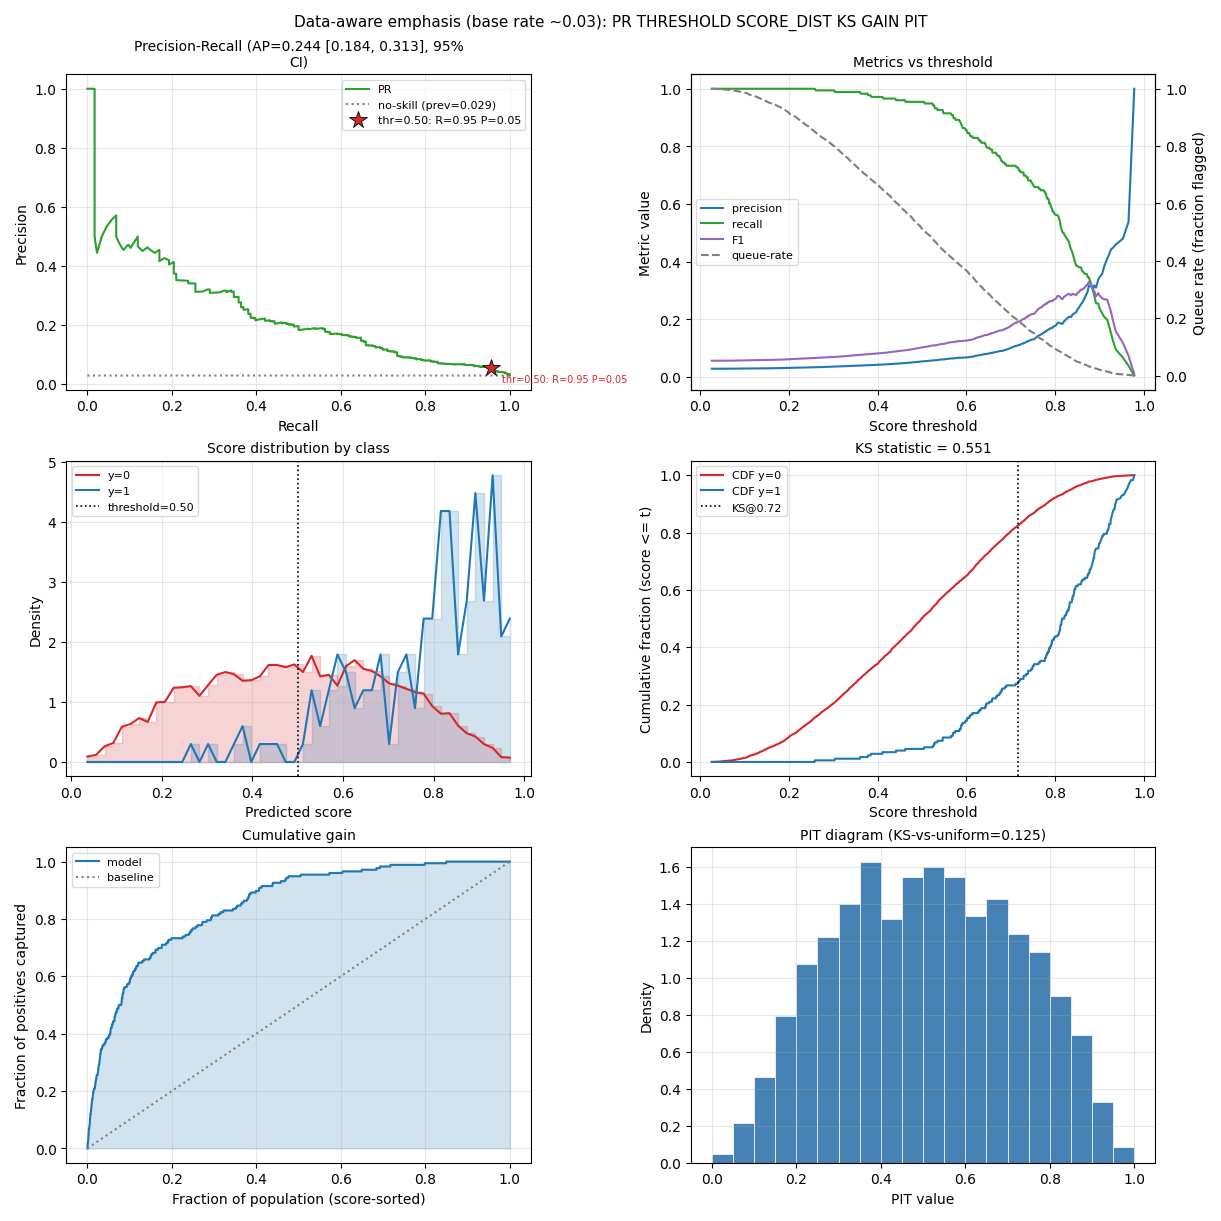
panel_emphasis_imbalanced
Data-aware panel emphasis on a rare-event target (base rate ~0.03): the adaptive order leads with PR + threshold-sweep and drops the optimistic-under-imbalance ROC, so the operator sees the diagnostics that actually matter under skew first.
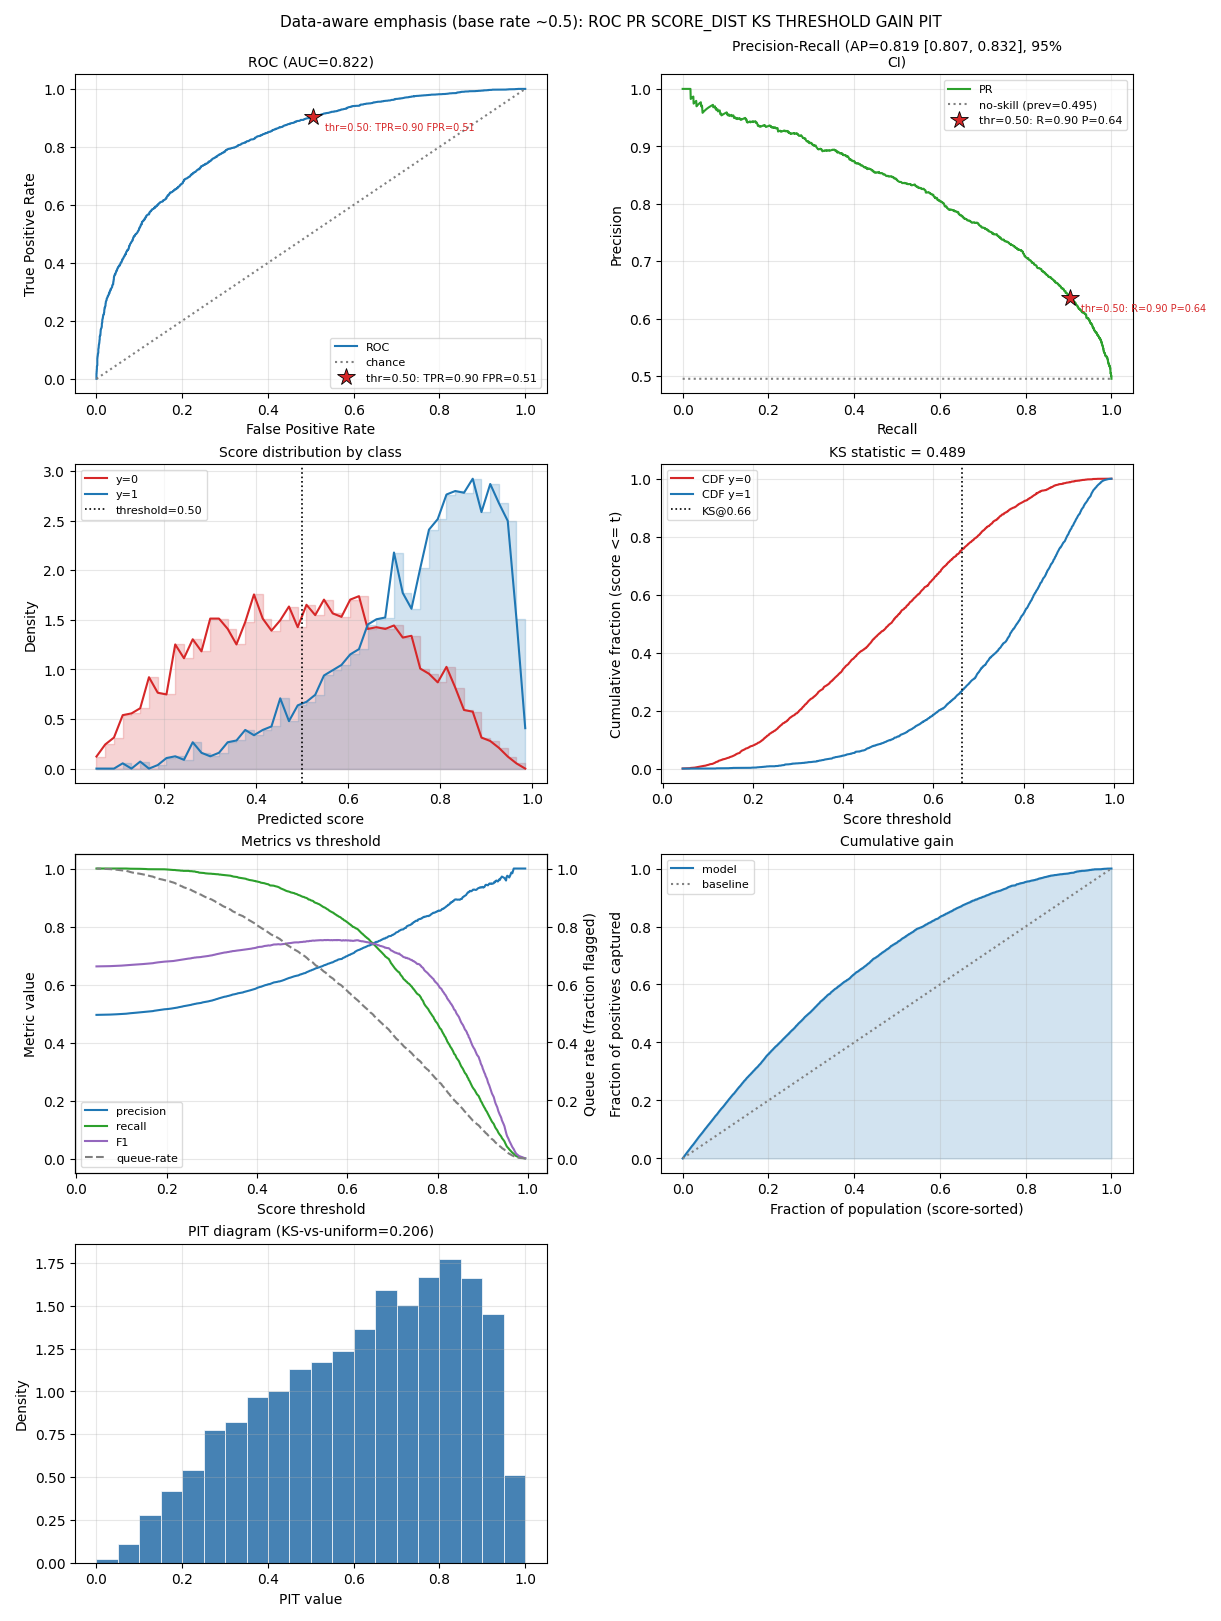
panel_emphasis_balanced
Data-aware panel emphasis on a balanced target (base rate ~0.5): the adaptive order leads with ROC, which is informative when the classes are even, ahead of PR / score-dist / KS / threshold.
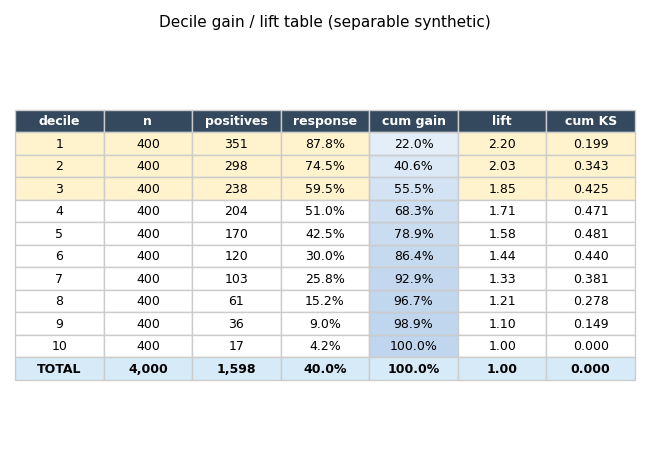
decile_table
Credit-scoring decile gain/lift table: per-decile response / cumulative-gain / lift / cumulative-KS (top deciles highlighted, TOTAL row).
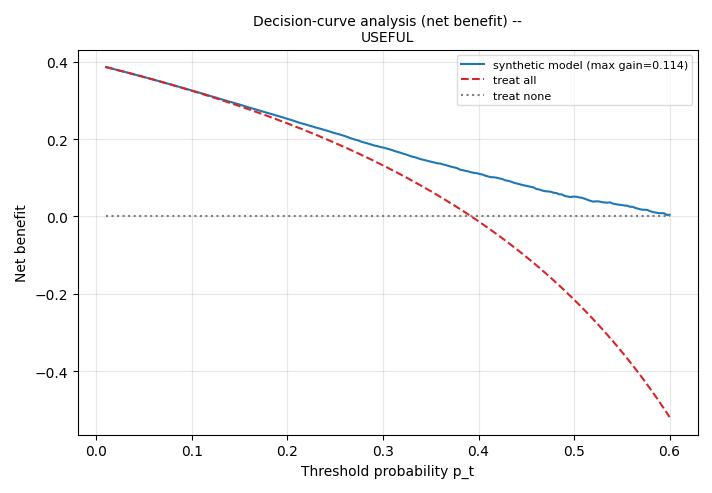
decision_curve
Decision-curve analysis: model net-benefit vs treat-all / treat-none policies.
calibration_reliability
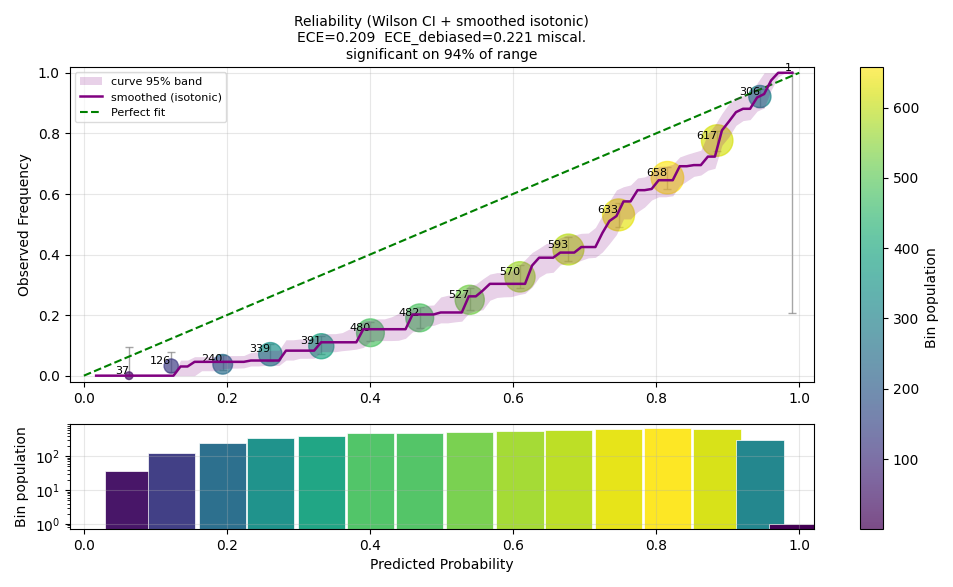
Reliability diagram with Wilson CI bands + binning-free smoothed (isotonic) overlay + bootstrap 95% band (significant-fraction annotation) + standard & debiased ECE annotation + population histogram.
risk_coverage
risk_coverage
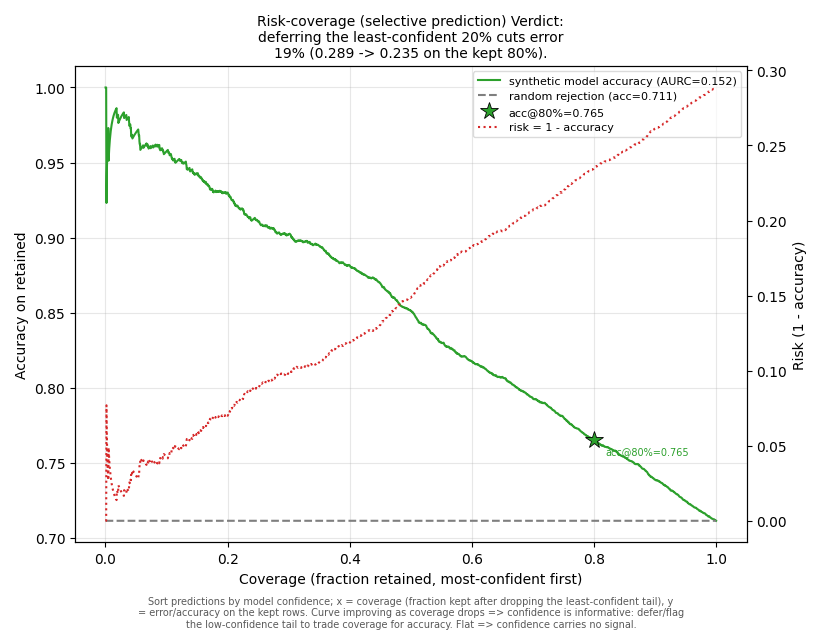
Risk-coverage (selective prediction): accuracy rises as you abstain on the least-confident cases; gap over the flat random-rejection line is the value of confidence-ranked deferral.
model_card
model_card_binary
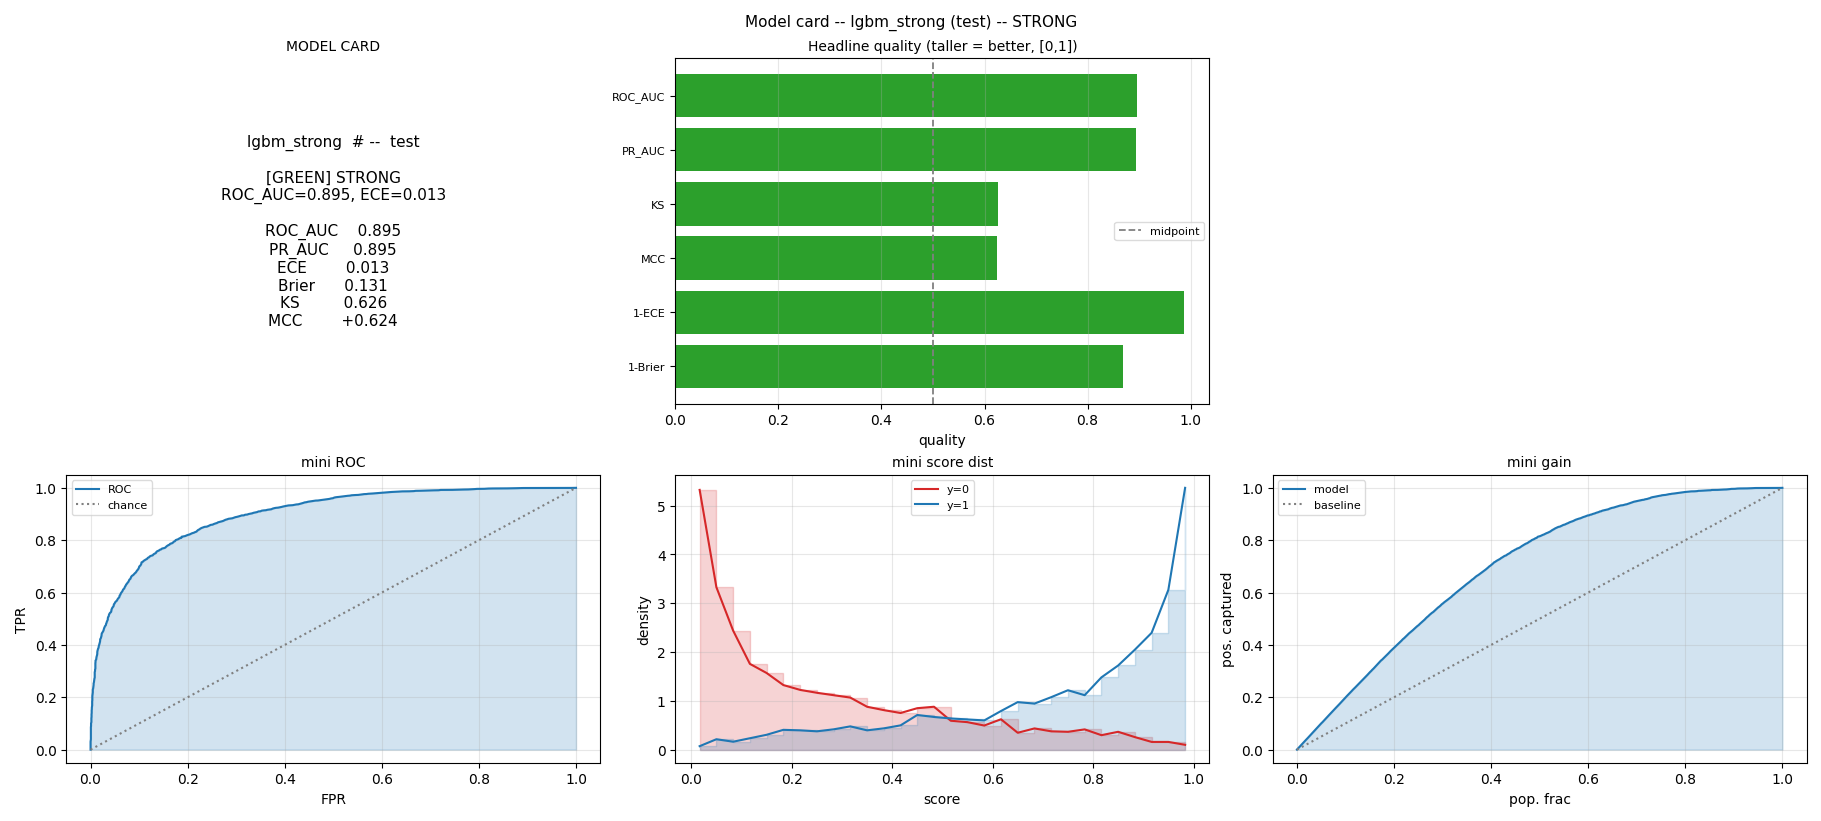
One-glance executive model card: headline metrics + GREEN traffic-light verdict + mini ROC / score-dist / gain sparklines.
model_card_regression
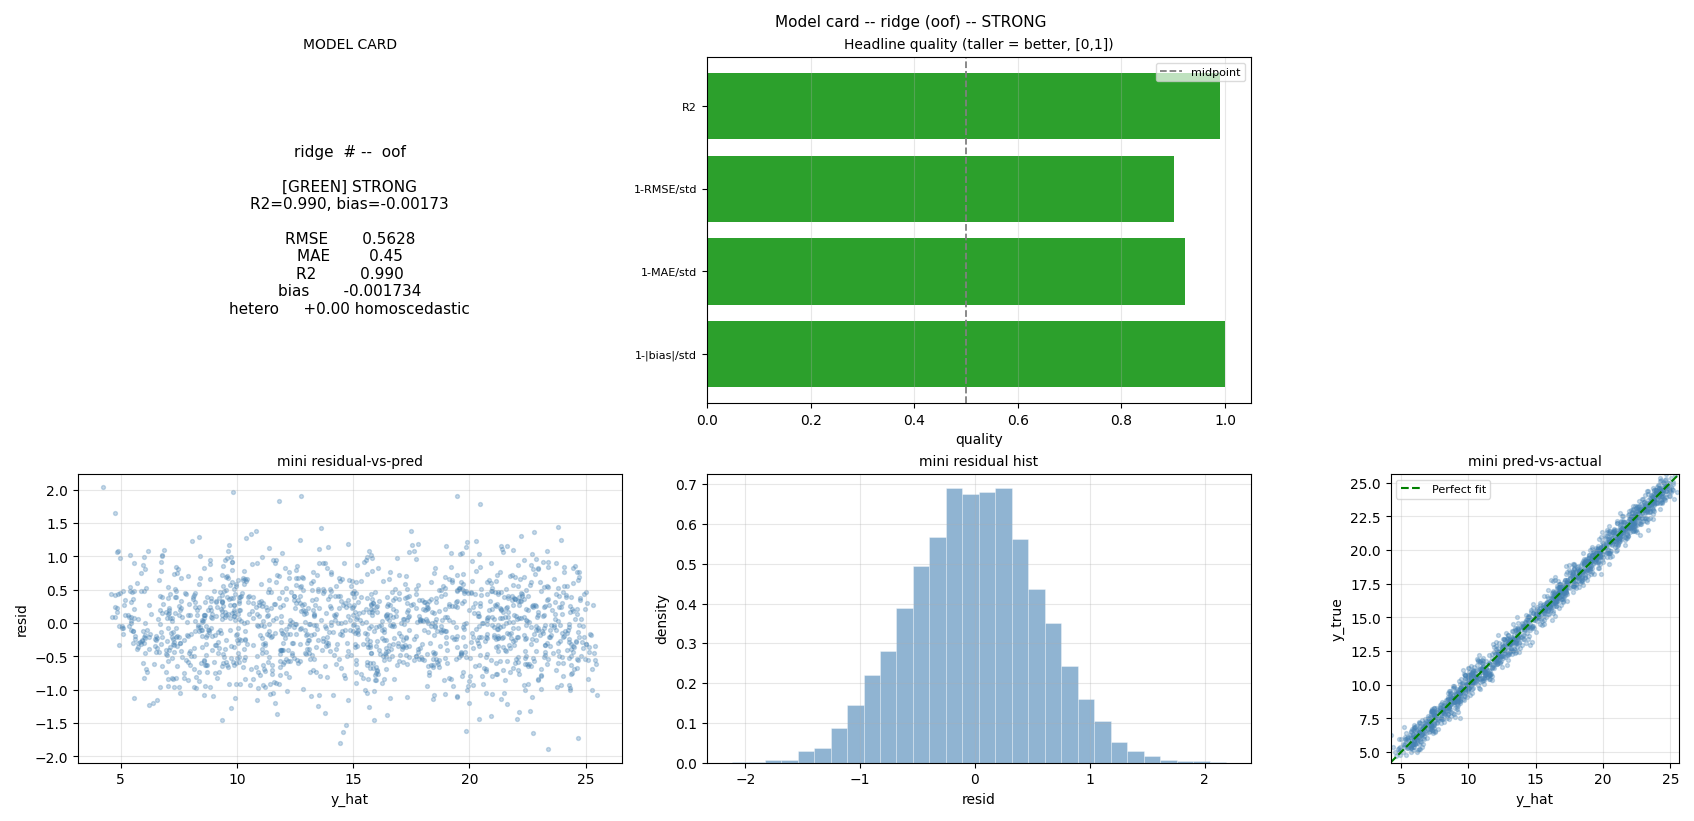
Regression model card: RMSE/MAE/R2/bias headline + verdict + mini residual-vs-pred / residual-hist / pred-vs-actual sparklines.
multiclass
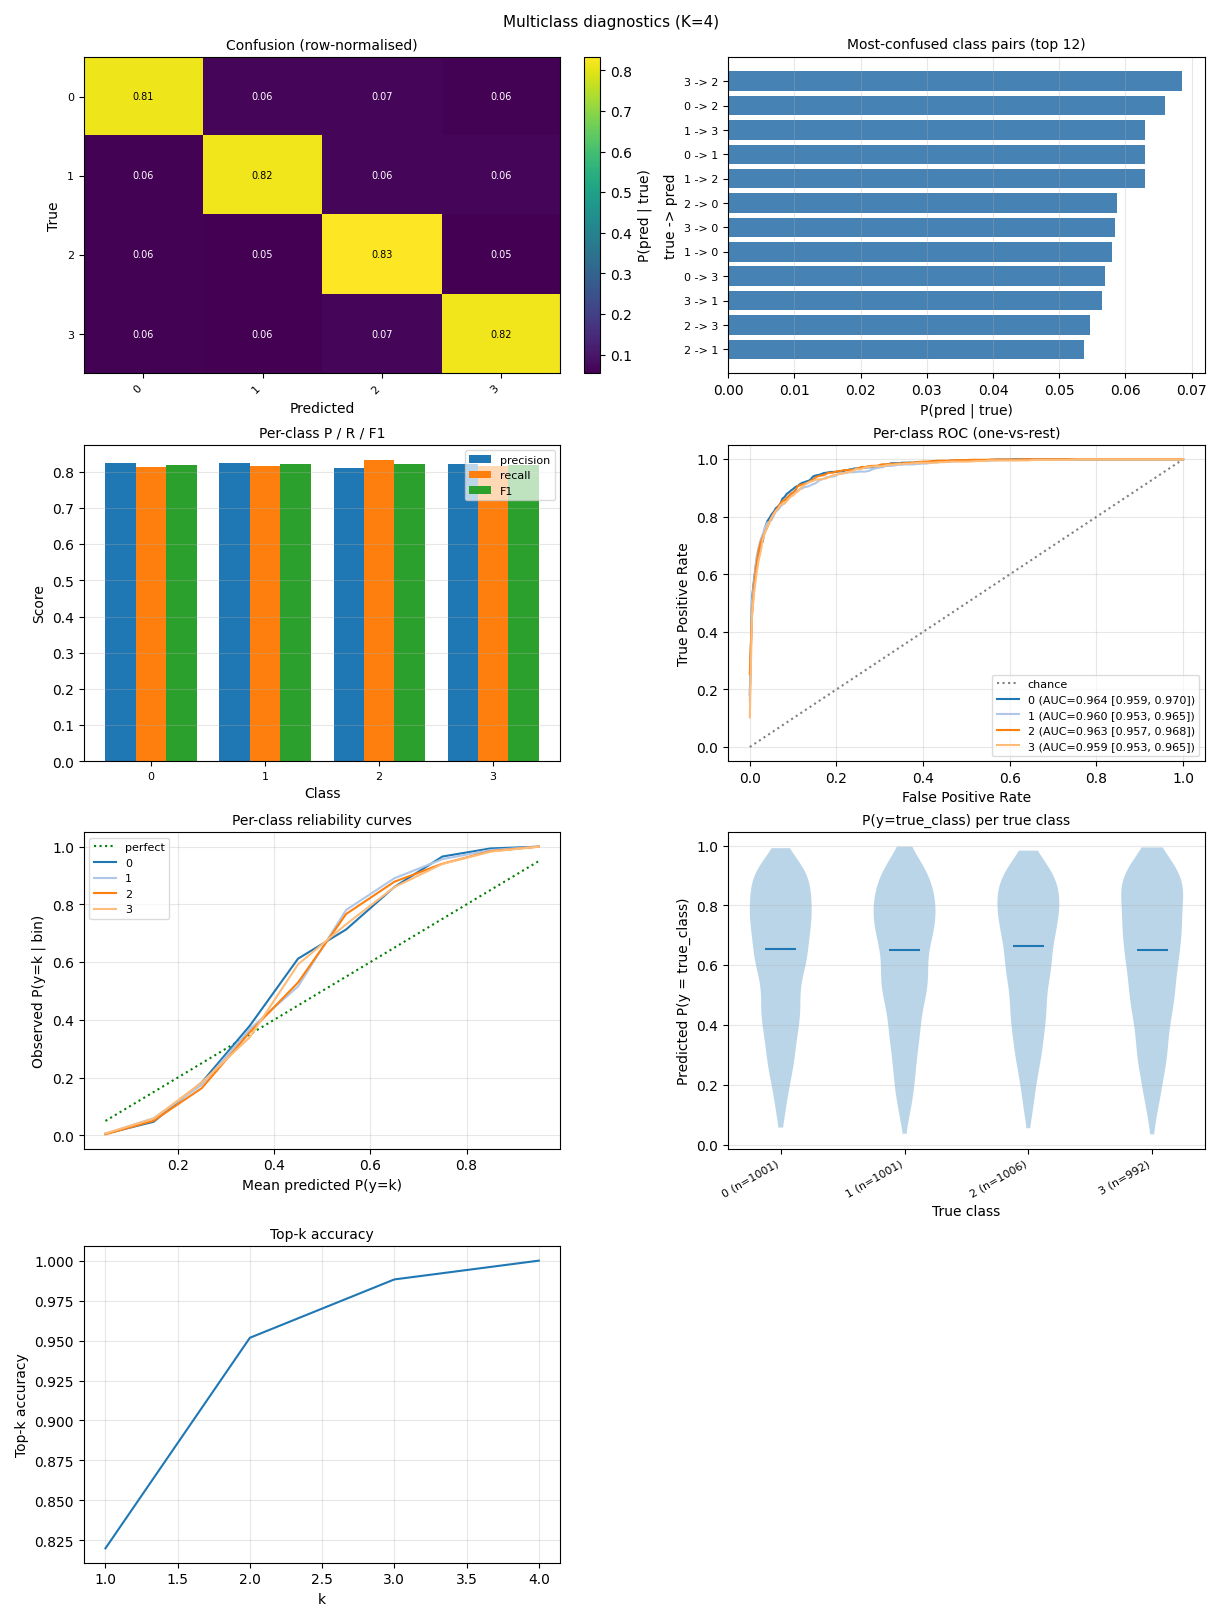
multiclass_full
Normalized confusion, confused pairs, per-class P/R/F1, per-class ROC (DeLong CI), reliability, prob dist, top-k.
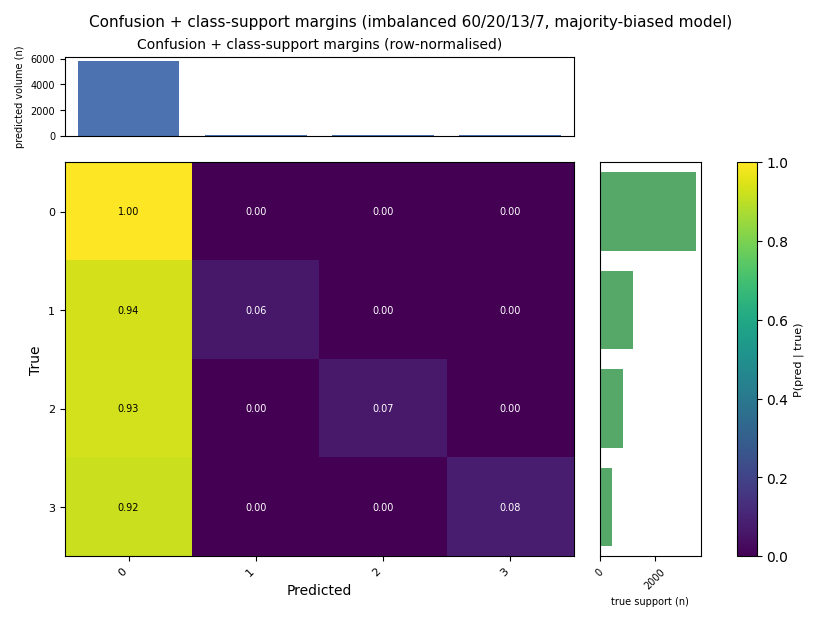
confusion_margins
Confusion heatmap flanked by class-support margins: right bar = per-true-class support, top bar = per-predicted-class volume. On an imbalanced + majority-biased synthetic the dominant class's support bar towers over the minorities and its predicted-volume bar exceeds its support, revealing imbalance + over-prediction at a glance.
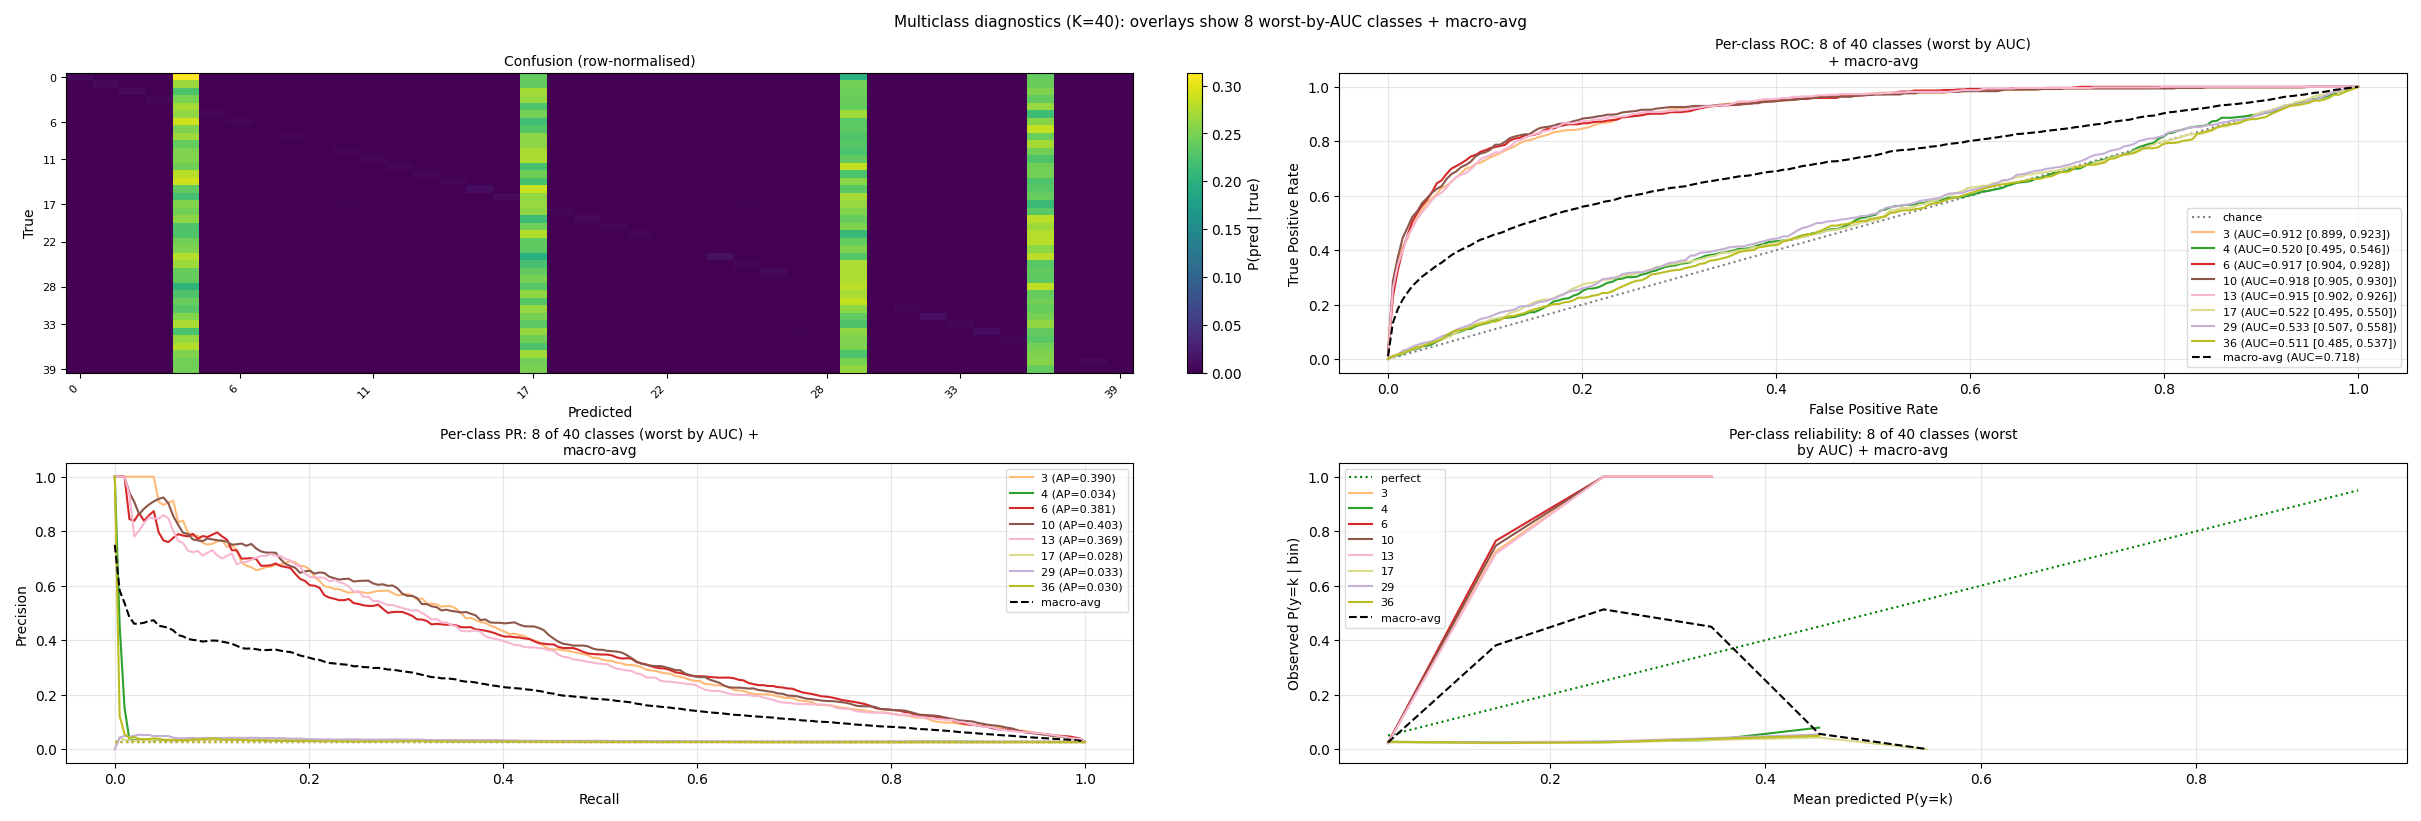
multiclass_largeK
Large-K (K=40): per-class ROC / PR / reliability overlays auto-switch to the 8 worst-by-AUC classes + a macro-average instead of 40 spaghetti curves.
multilabel
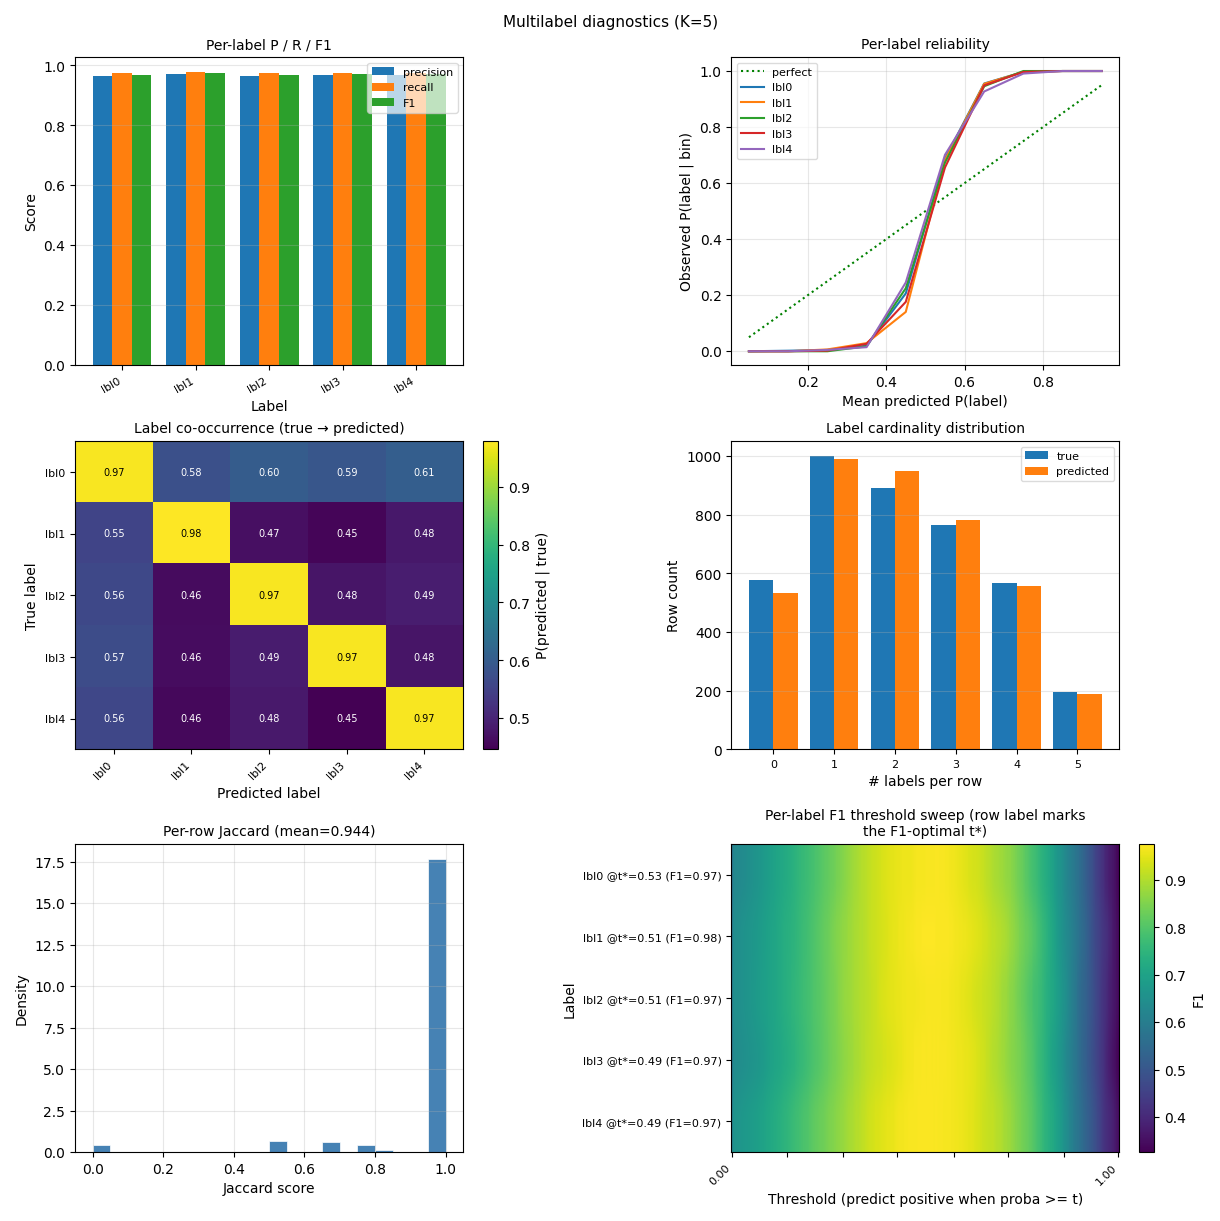
multilabel_full
Per-label P/R/F1, reliability, co-occurrence, cardinality, Jaccard dist, threshold-sweep heatmap.
ltr
ltr_full
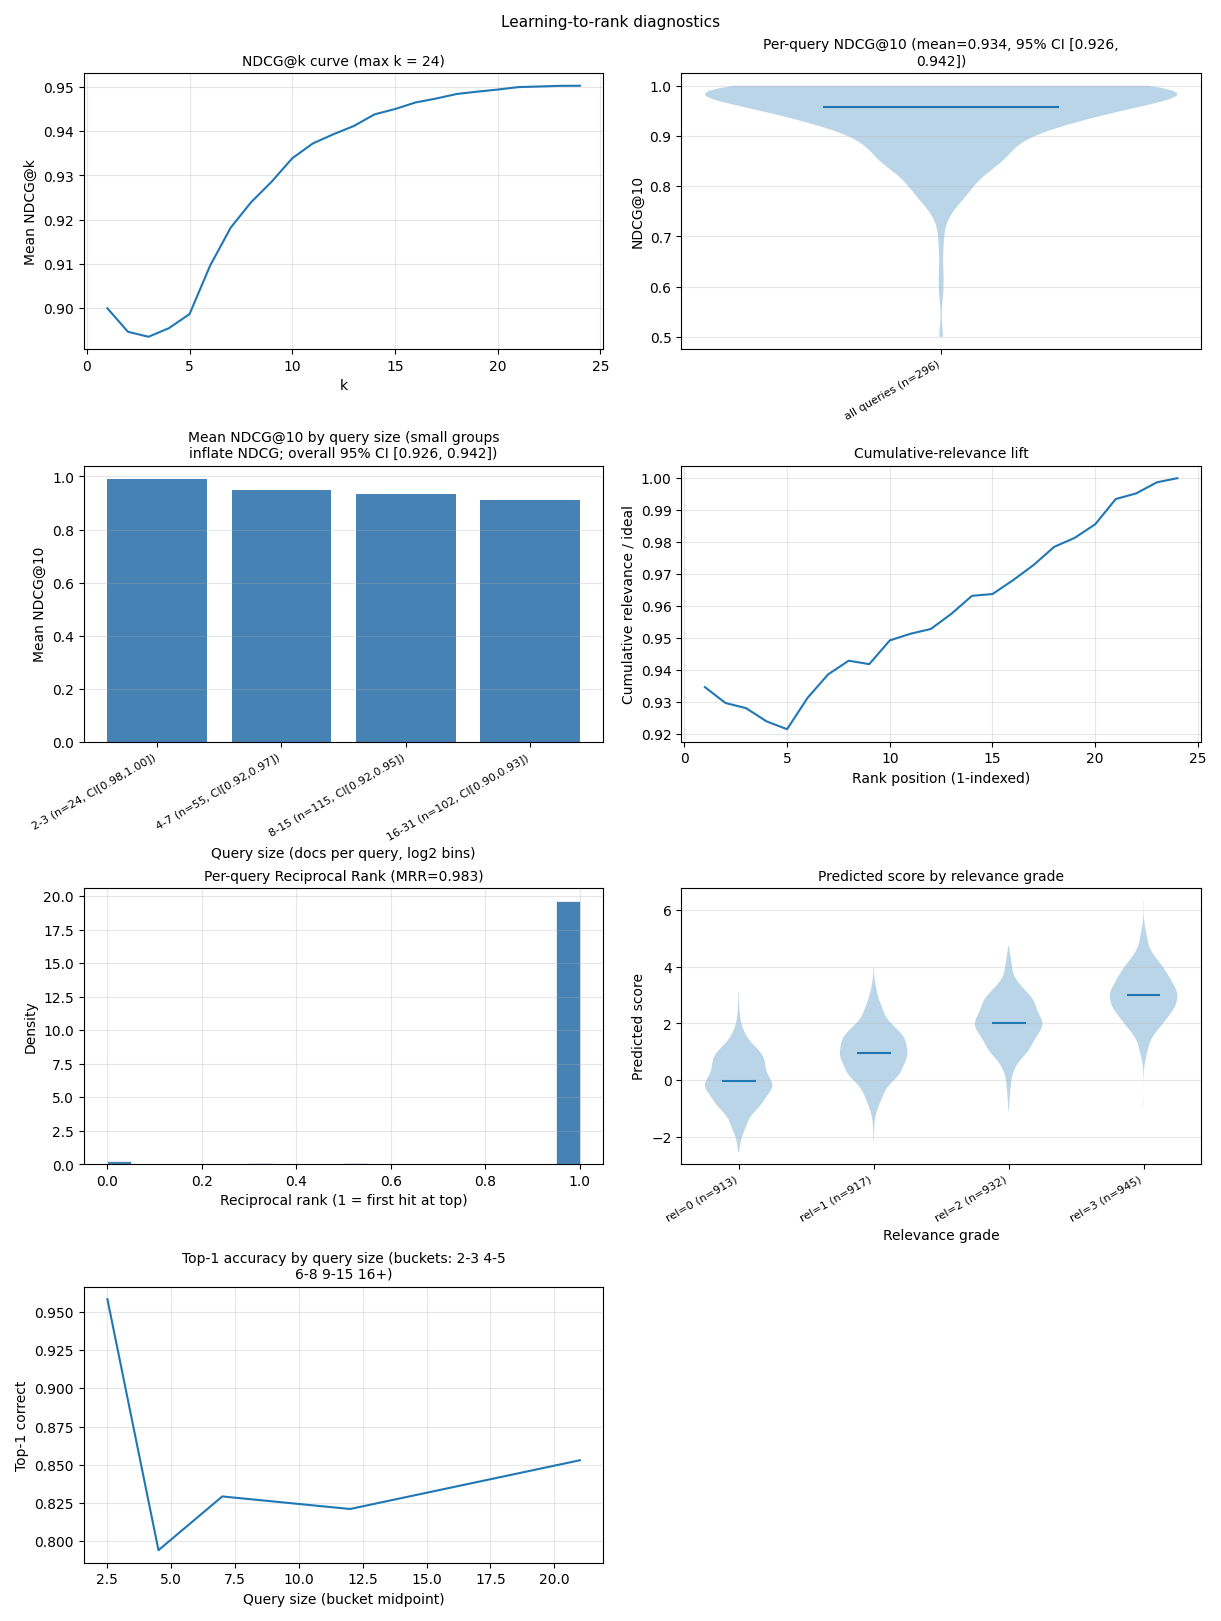
NDCG@k, per-query NDCG dist, NDCG by query size, lift, MRR dist, score-by-relevance, top-1 by query size.
quantile
quantile_full
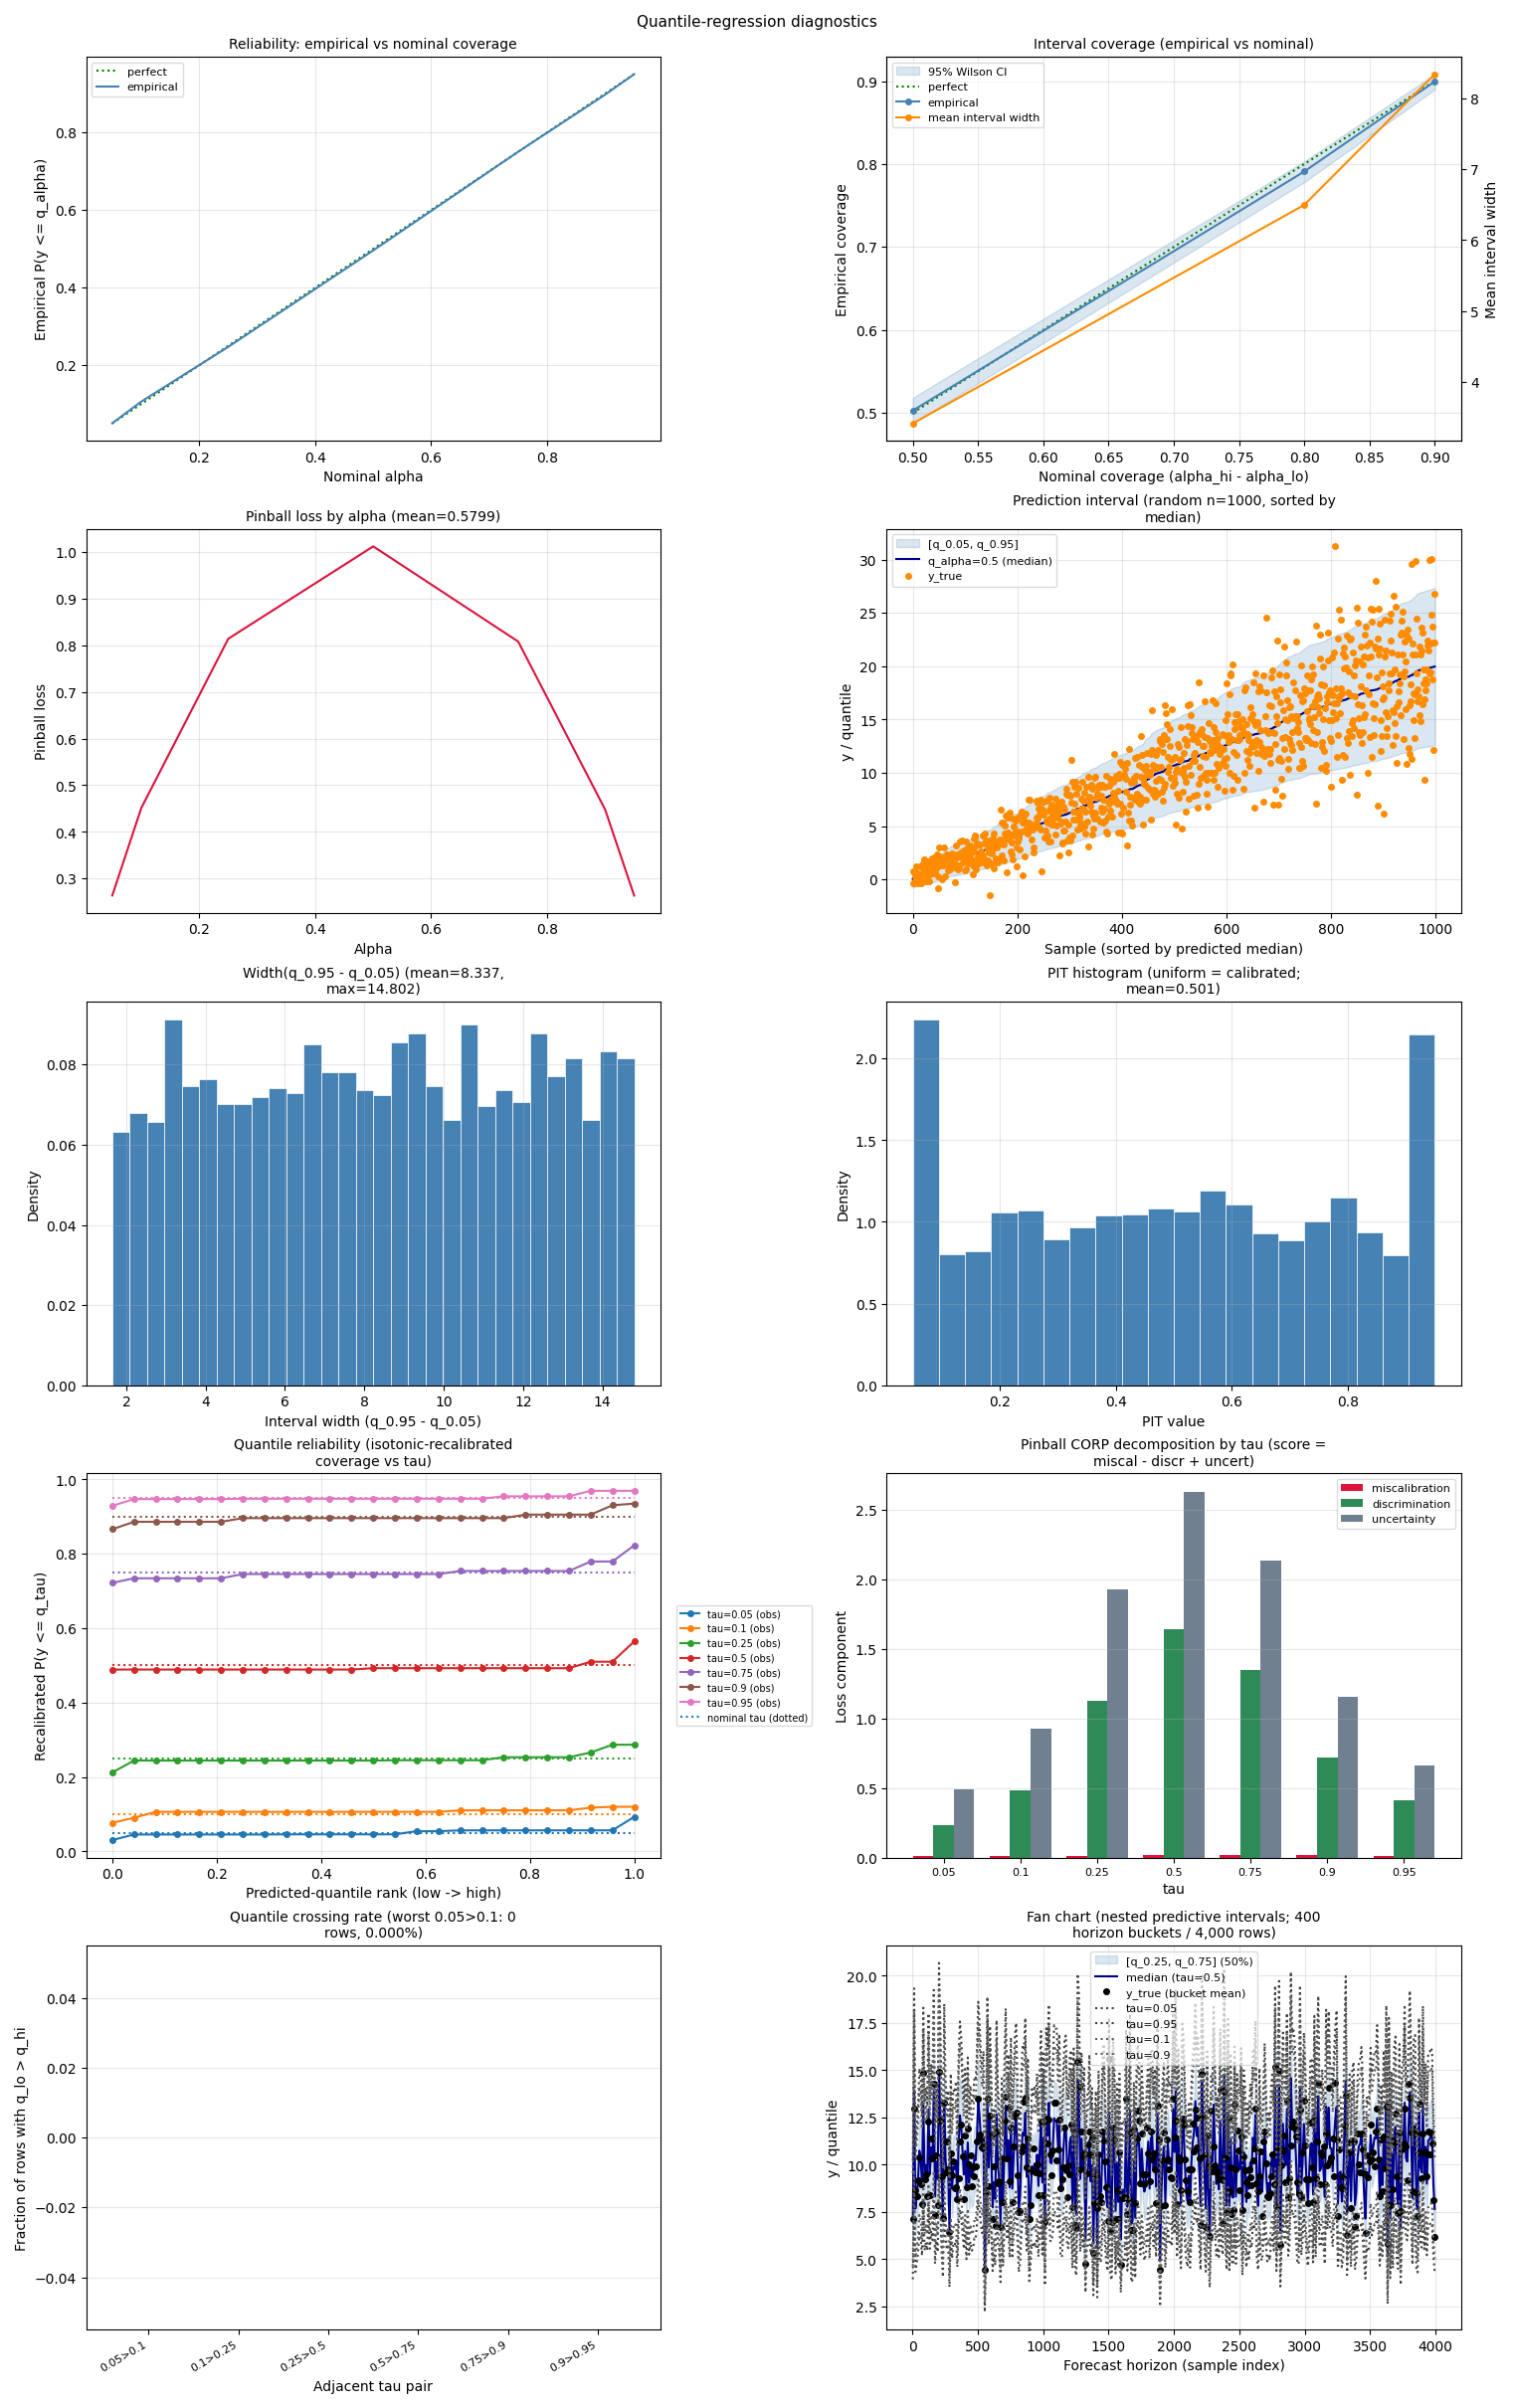
Reliability, coverage, pinball-by-alpha, interval band, width dist, PIT, quantile reliability, pinball decomp, crossing, fan chart.
drift
psi_heatmap
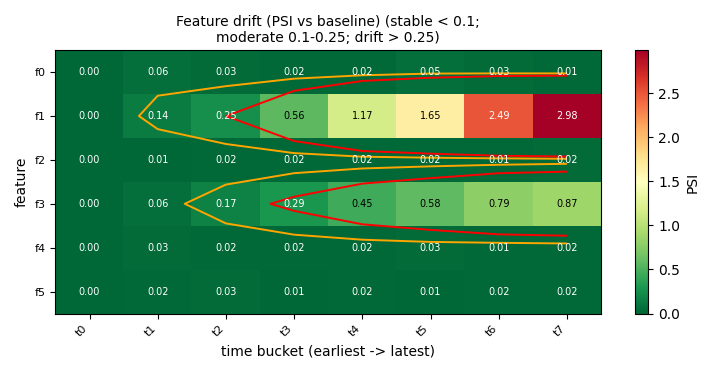
Population Stability Index per feature per time bucket vs baseline (drifted features turn red).
residual_vs_time
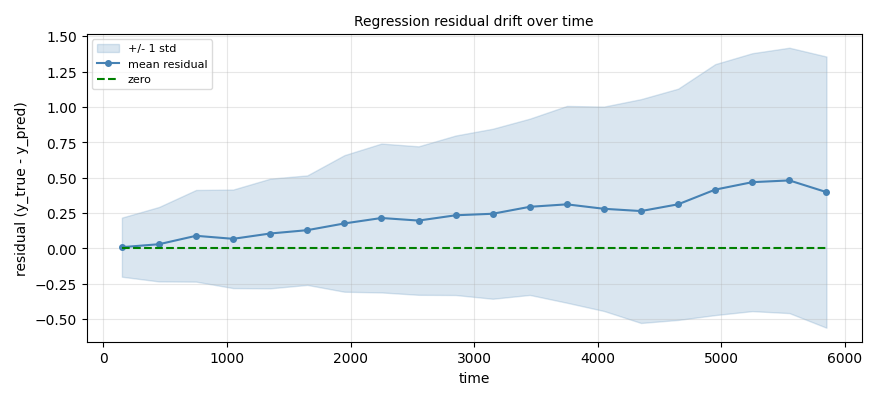
Regression residual mean +/- std per time bin: bias drift + variance drift over time.
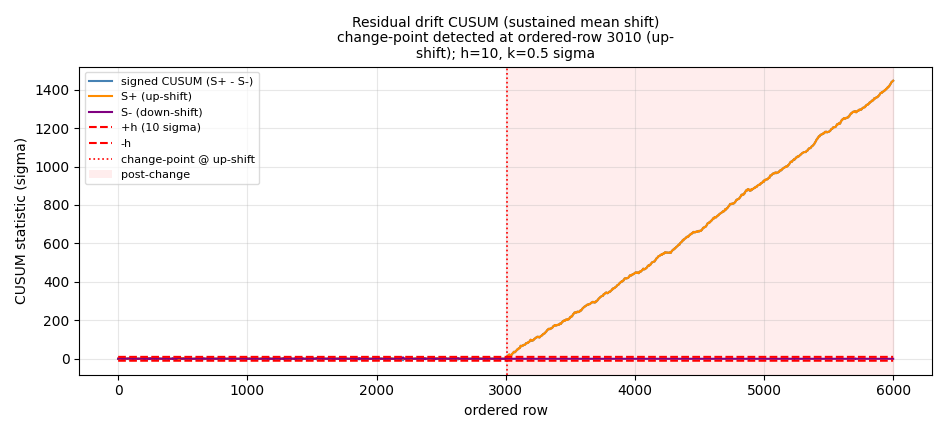
cusum_residual_drift
Two-sided tabular CUSUM of standardized residuals: a sustained mean shift trips the control limit (change-point marked).
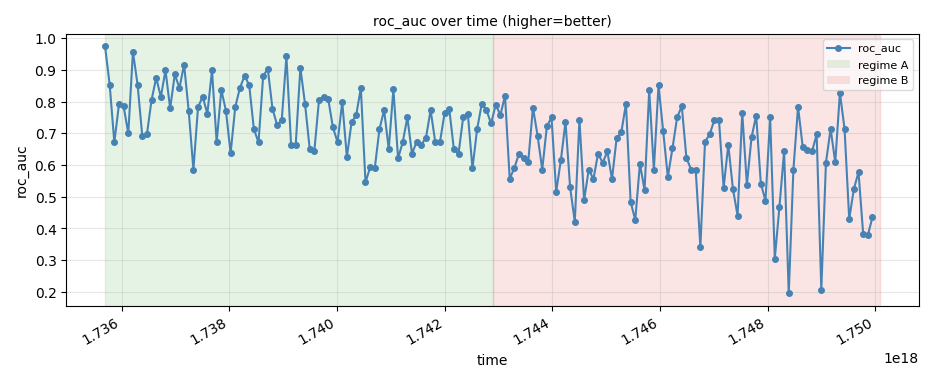
metric_over_time
Rolling metric per time bucket with regime shading.
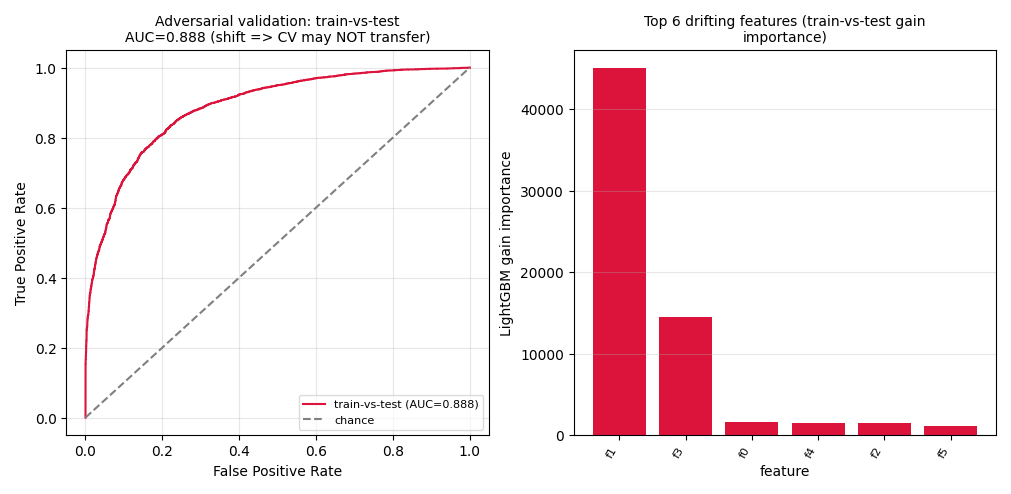
adversarial_validation
Train-vs-test LightGBM separability ROC + AUC + top drifting features.
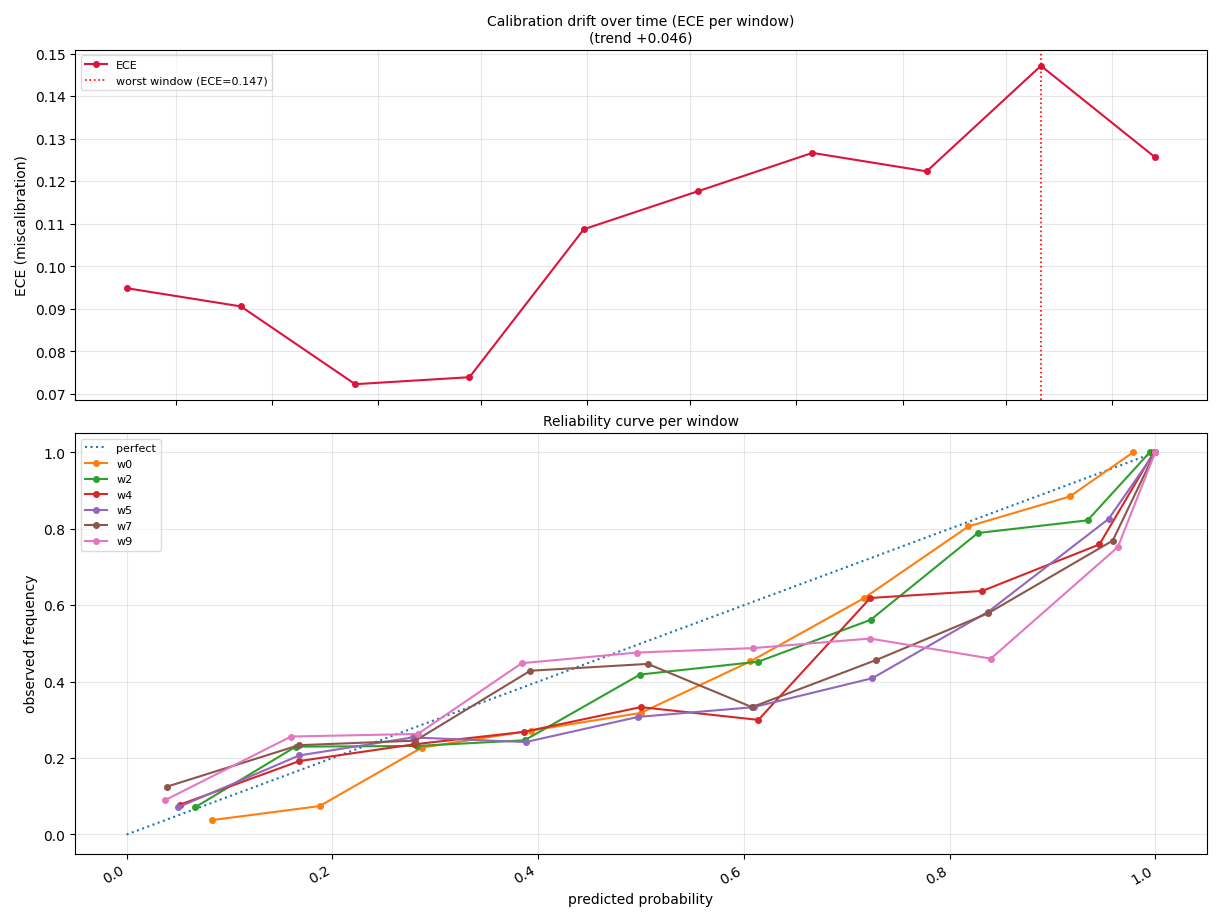
calibration_drift
calibration_drift
ECE-over-time line + small-multiple per-window reliability curves.
error_analysis
weak_segment_heatmap
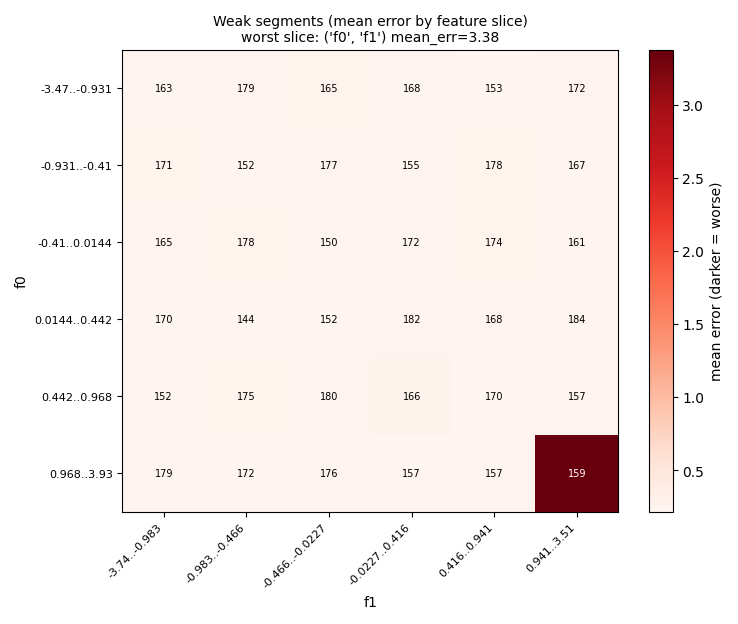
FreaAI-style weak-segment grid: mean error by feature slice (injected bad region shows as a hot cell).
error_bias_per_feature
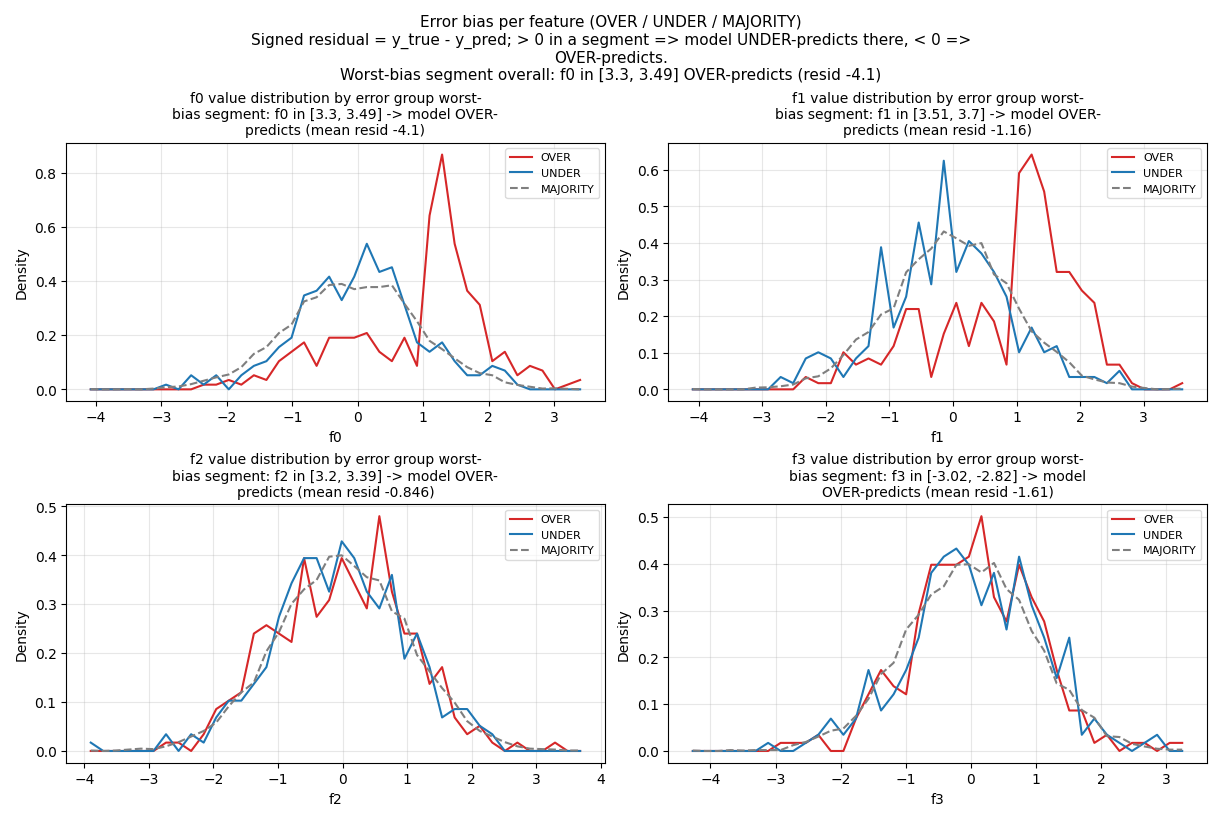
Evidently-style OVER/UNDER/MAJORITY feature-value distributions per feature.
target_dist_overlay
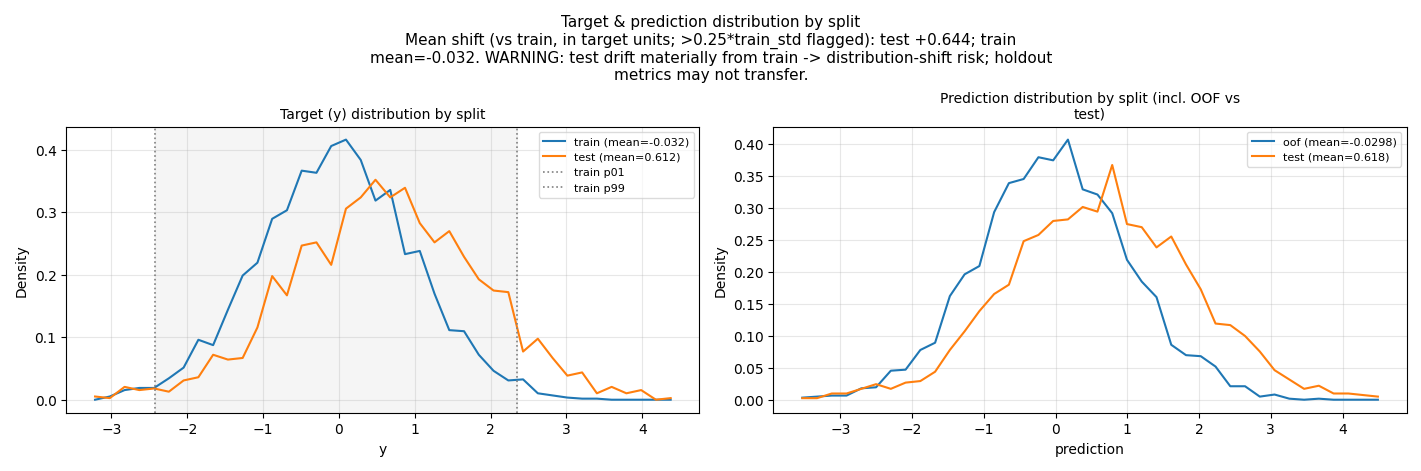
Per-split overlaid density histograms of target and predictions (train p01/p99 envelope).
segments_bar
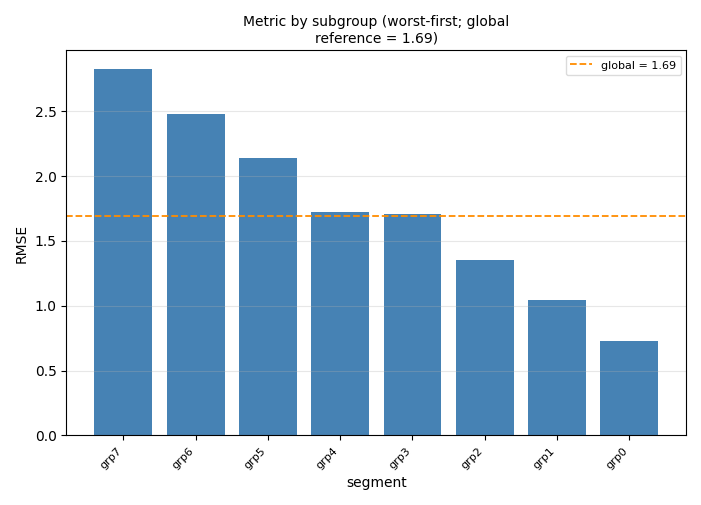
Per-subgroup metric bars with a global-reference line (worst-first).
prediction_stability
prediction_stability
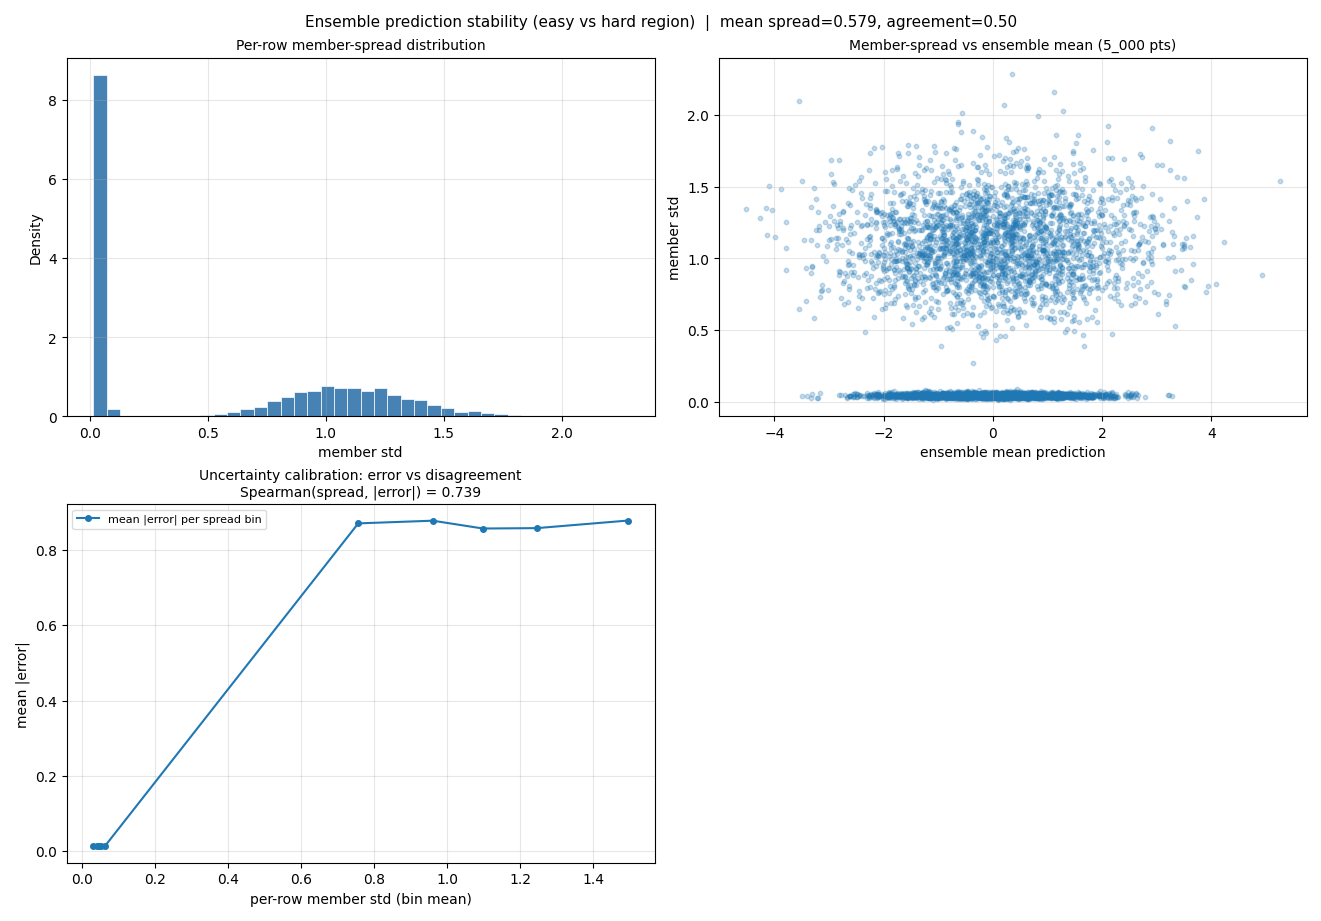
Ensemble member-disagreement: per-row spread histogram, spread-vs-mean scatter, uncertainty calibration (mean |error| rises with disagreement).
slice_finder
slice_finder
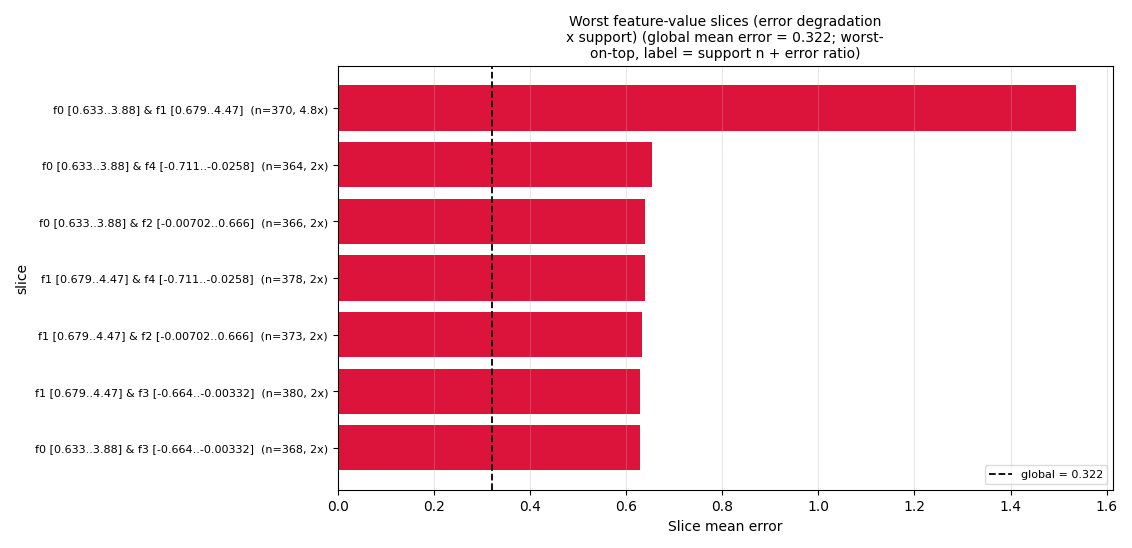
Worst-K feature-value slices ranked by error-degradation x support.
fairness_calibration
fairness_calibration
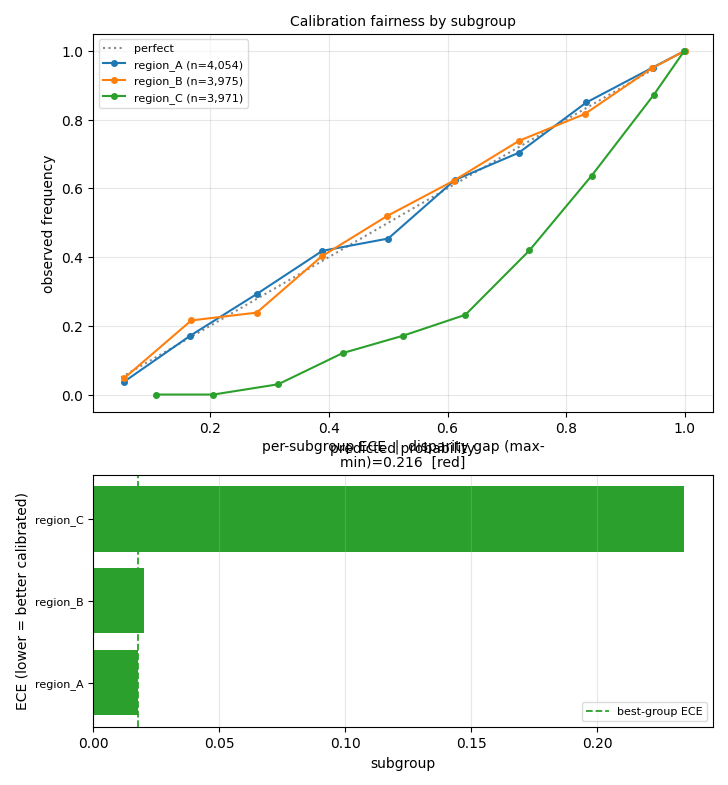
Per-subgroup reliability overlay + per-group ECE bar; max-min ECE gap as a calibration-fairness disparity (one group deliberately miscalibrated).
calibration_by_feature
calibration_by_feature
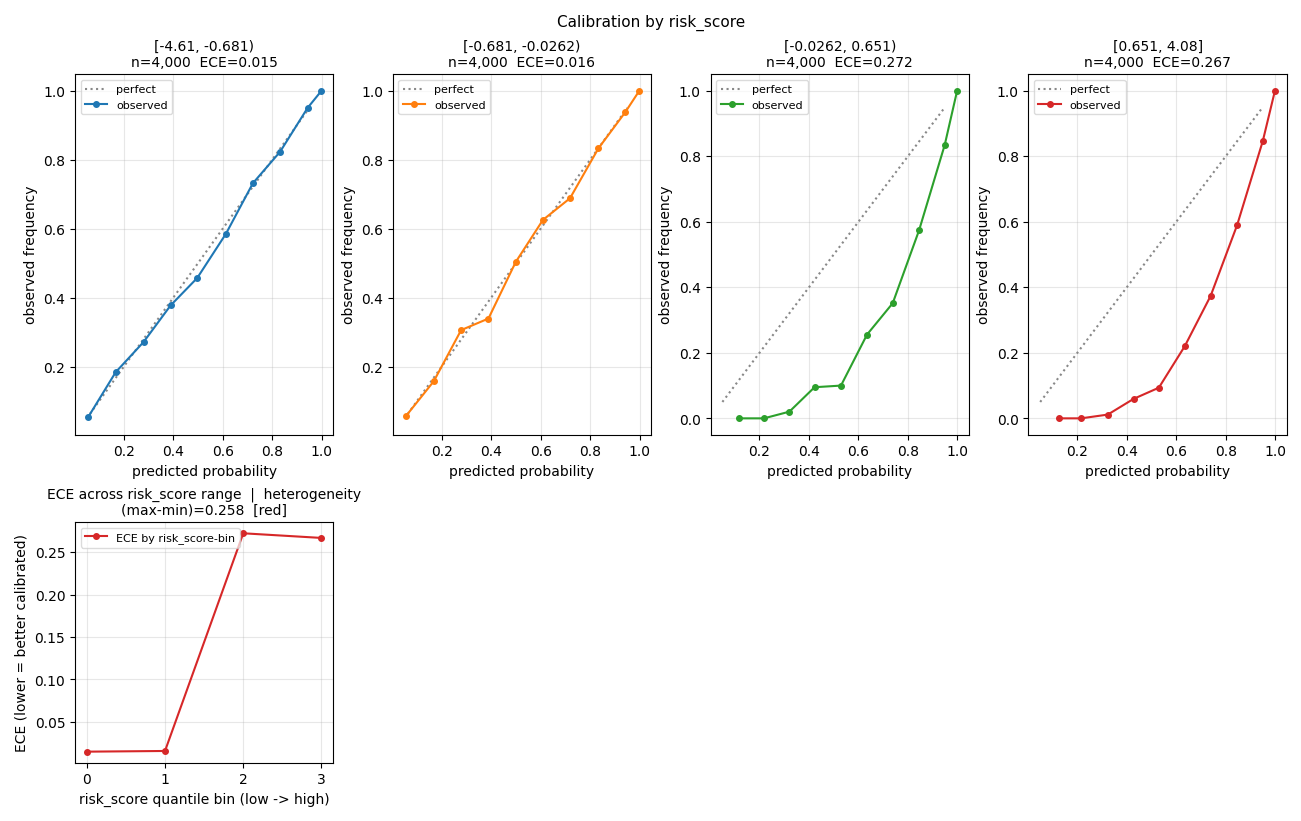
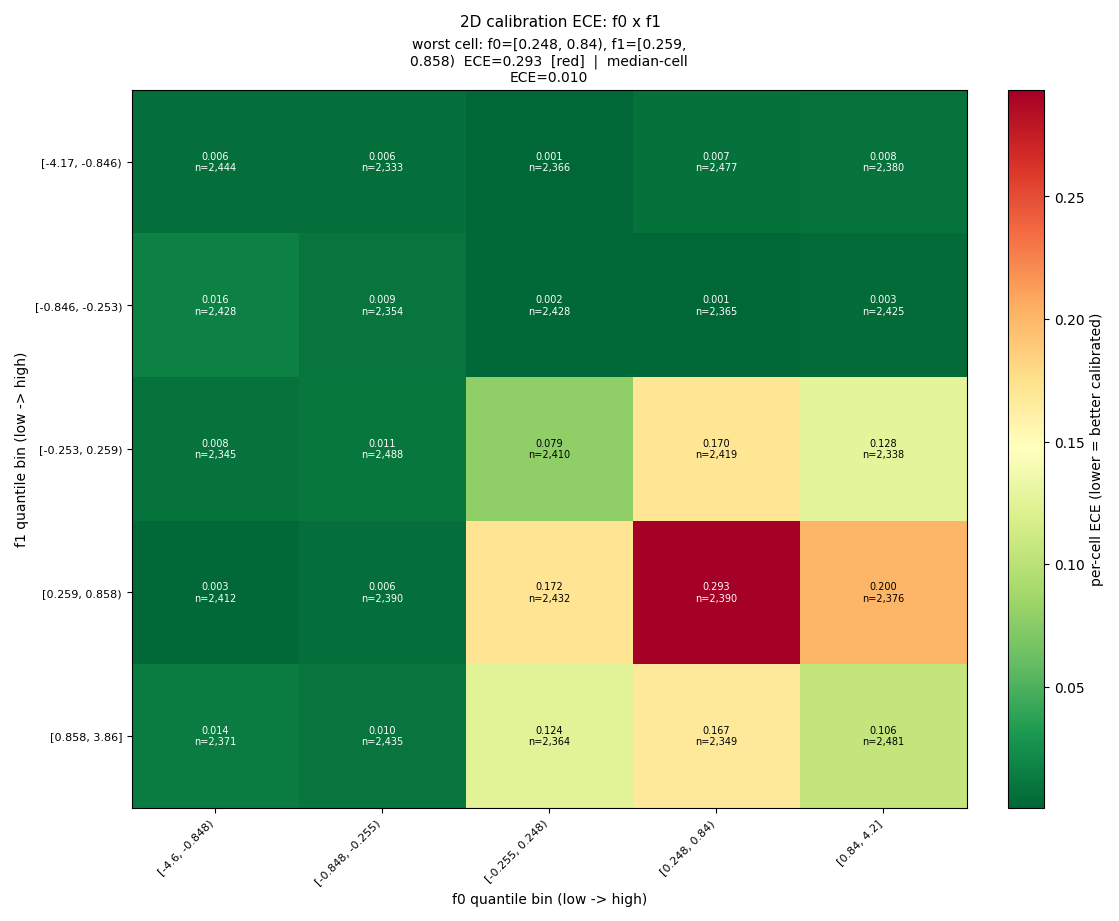
Per-feature calibration: reliability + ECE conditioned on quantile bins of a continuous feature. The model is calibrated for low feature values but overconfident for high ones, so the per-bin ECE line climbs across the feature range and the max-min heterogeneity metric trips red -- a miscalibration a single pooled curve hides.
calibration_heatmap_2d
calibration_heatmap_2d
2D calibration-ECE heatmap over a quantile grid of two features. The model is overconfident ONLY in the high-f0 AND high-f1 corner (a localized pocket either 1D view averages away); that corner cell lights up red on the RdYlGn_r grid while the rest stays green, and the worst-cell ECE + location is the headline.
pdp_ice
pdp_ice
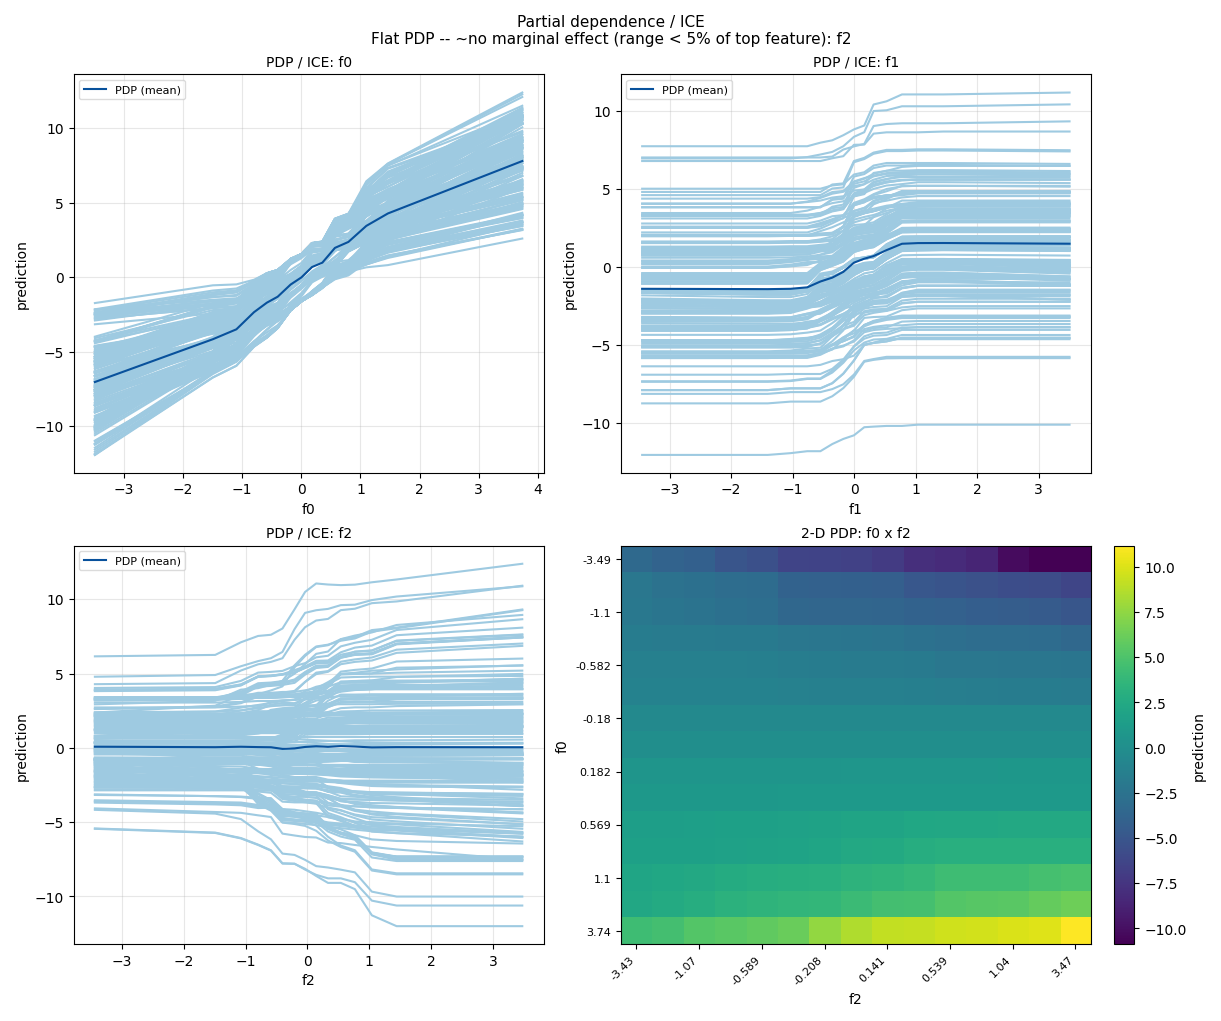
1-D PDP+ICE for the top features and a 2-D PDP interaction heatmap (small sklearn model).
pdp_2d
pdp_2d
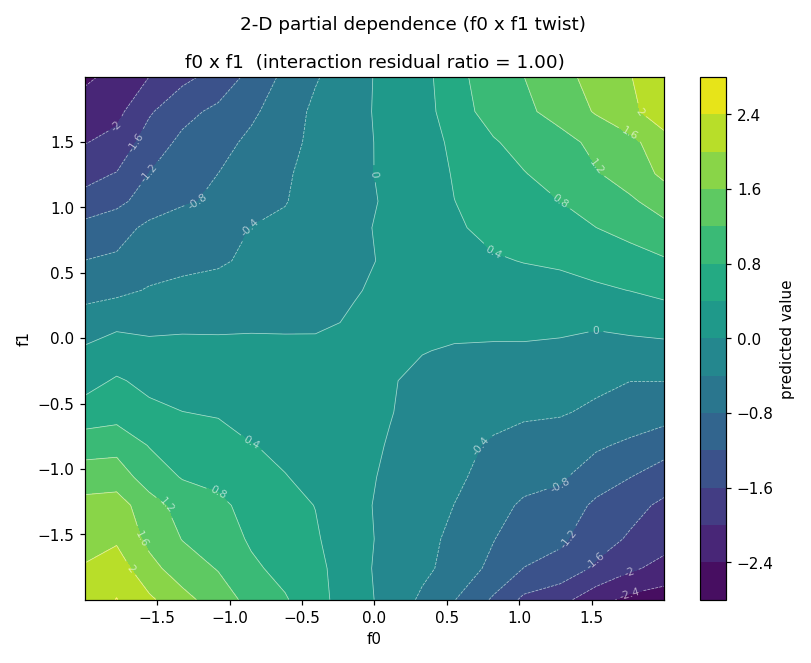
2-D partial-dependence response surface (filled contour) for the top interacting feature pair on a planted f0*f1 twist.
model_comparison
model_comparison
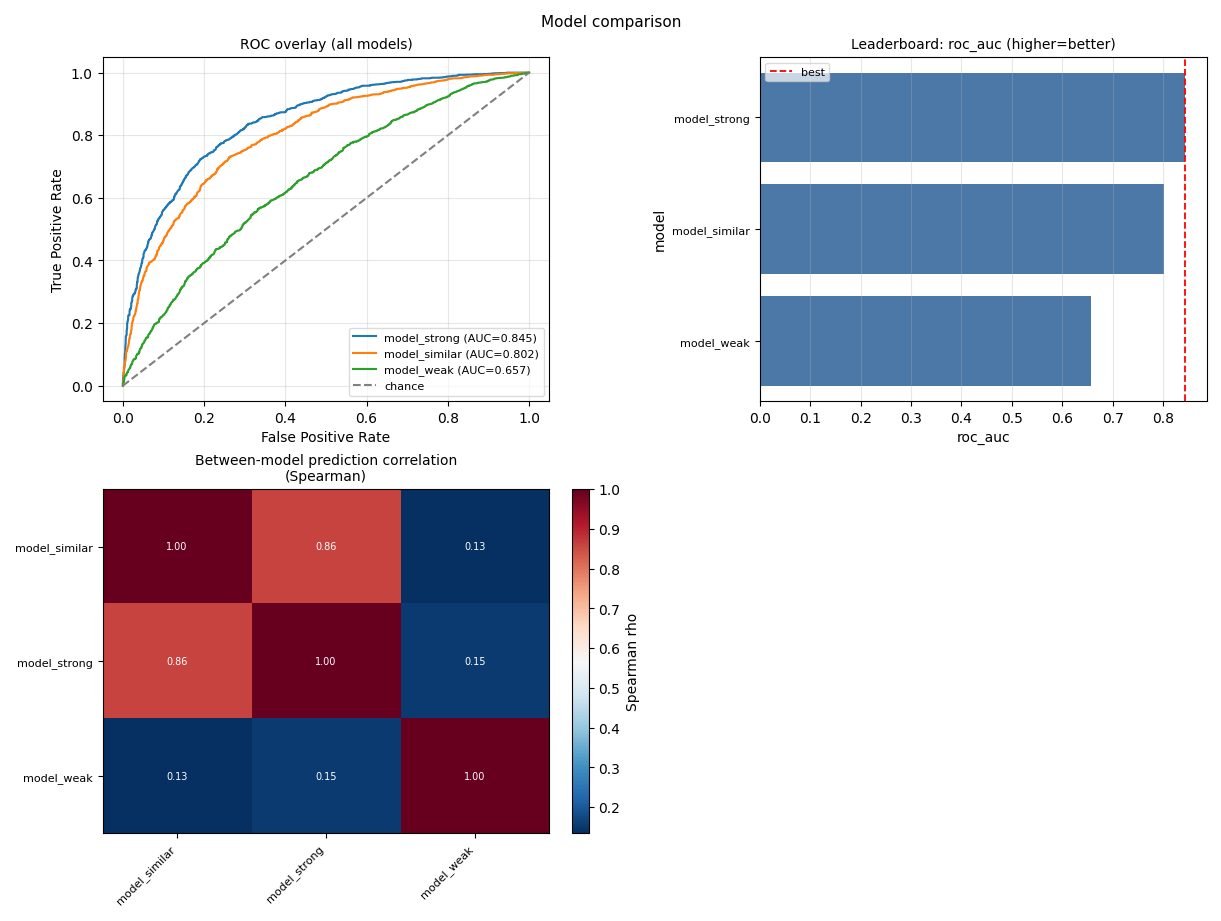
ROC overlay + leaderboard bars + between-model prediction-correlation heatmap (3 synthetic models).
split_comparison
split_comparison
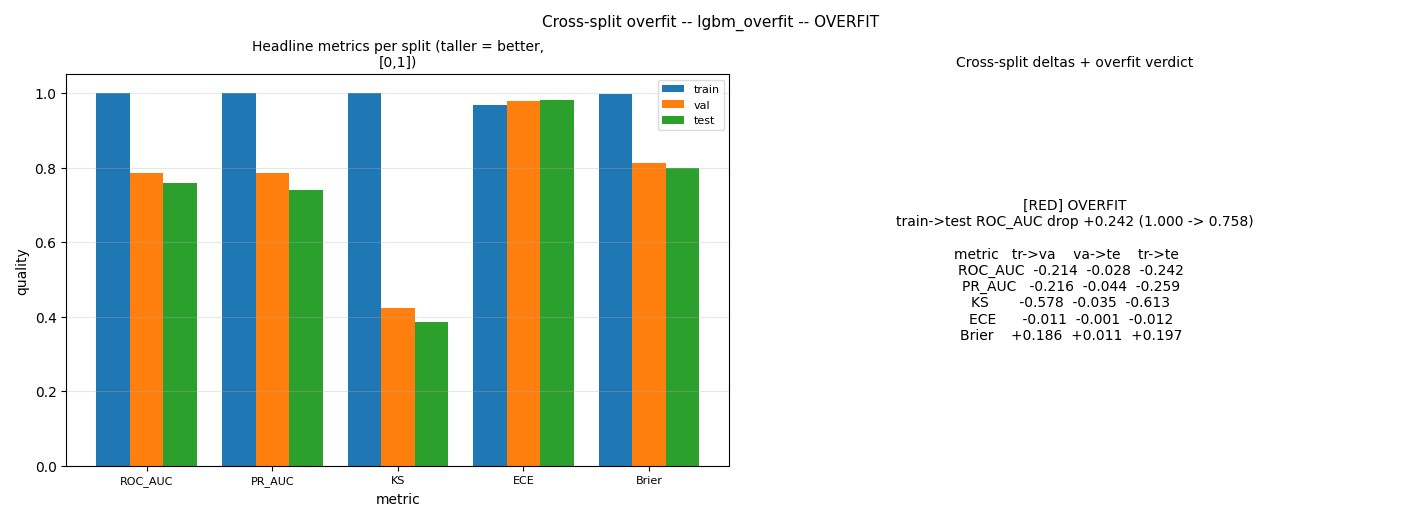
Cross-split overfitting view for ONE model: grouped headline-metric bars per train/val/test + delta table with a RED traffic-light verdict. Synthetic memorizes train (AUC ~0.99) but barely beats chance on test (AUC ~0.70).
training_curve
training_curve
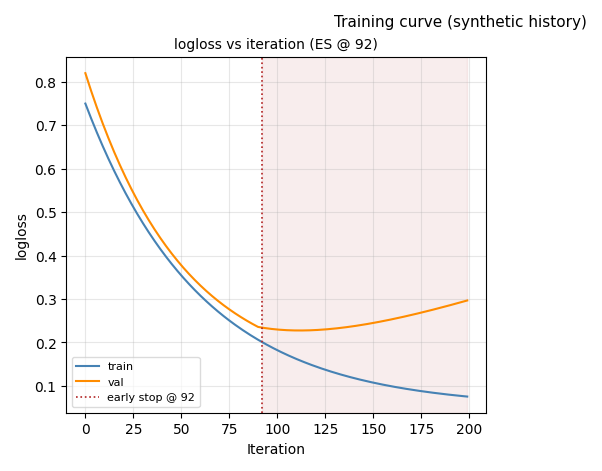
Train/val metric vs iteration with the early-stopping marker + post-ES shading.
learning_curve
learning_curve
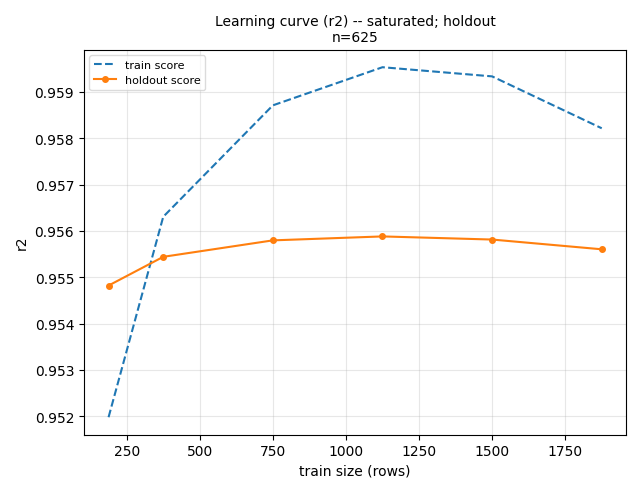
Holdout score vs increasing train size (cheap sklearn estimator on synthetic).
temporal
target_acf_pacf
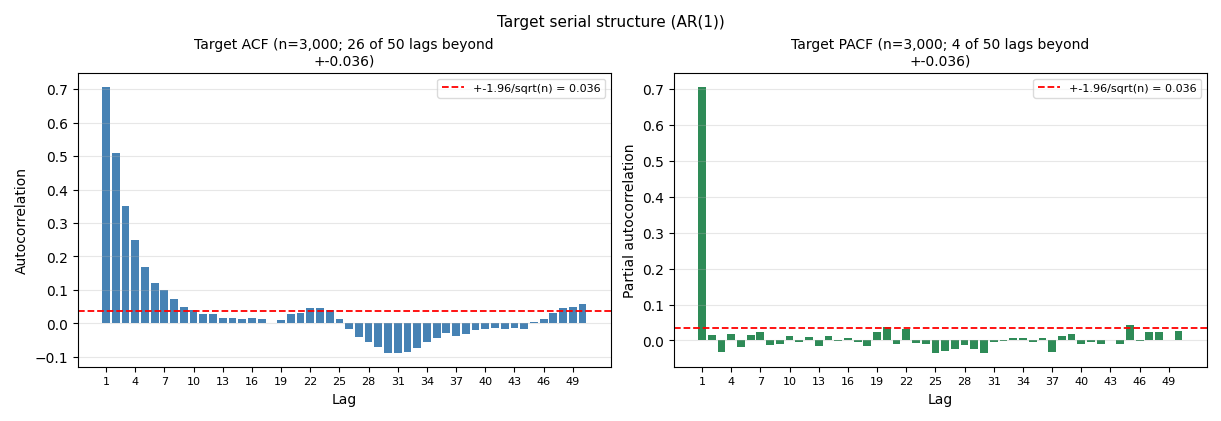
Target ACF + PACF by lag with Bartlett white-noise bounds (autocorrelated synthetic).
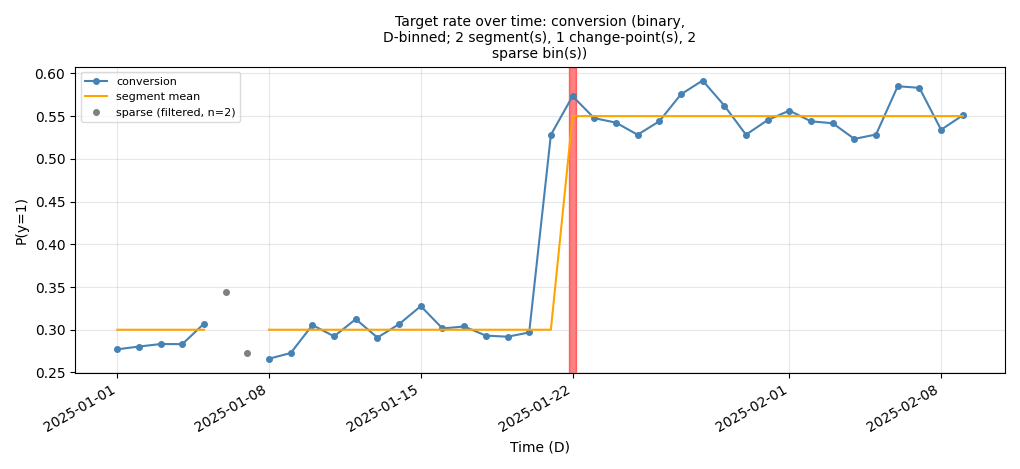
target_temporal_audit
Target-rate-over-time audit: kept bins, sparse bins, segment means, change-points.
fs_benchmark
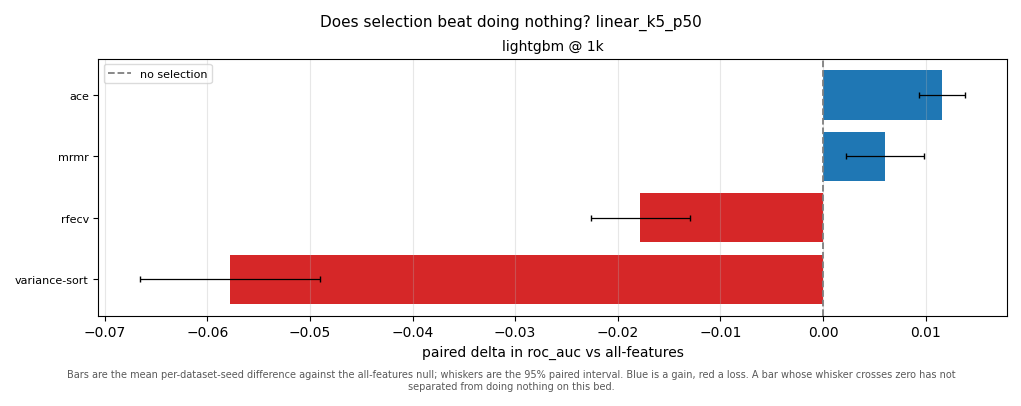
paired_contrast
Each arm's paired advantage over the all-features null on one bed, with confidence intervals. Signed bars, because the sign is the finding.
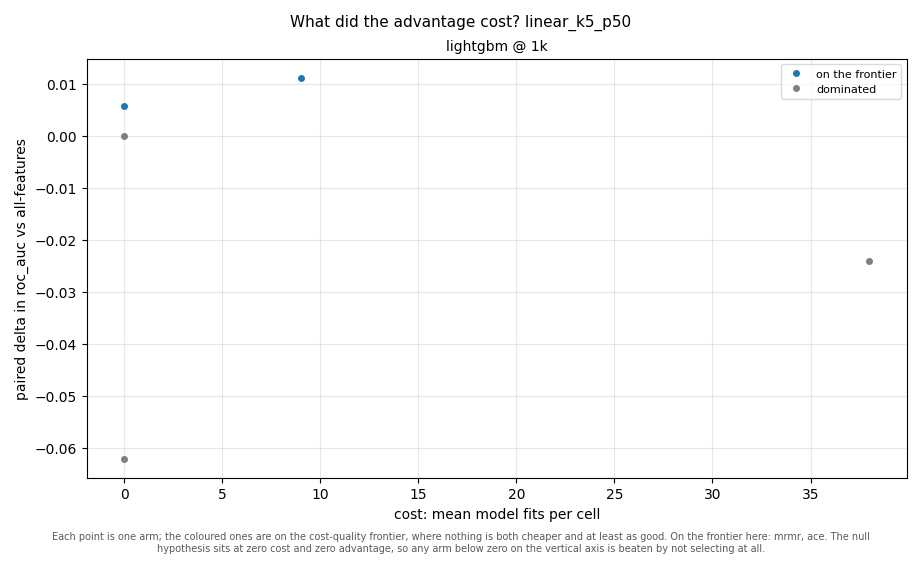
cost_vs_advantage_pareto
Model fits spent by the arm itself against its paired advantage, frontier arms labelled. Two axes rather than two y-scales, because cost and quality are different measures.
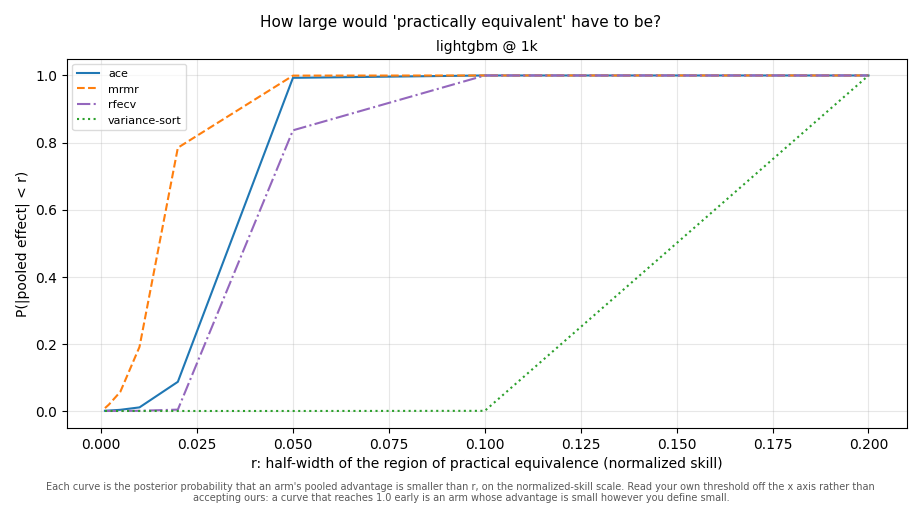
rope_curve
Posterior CDF of the absolute pooled effect, one line per arm: every reader applies their own threshold for practical equivalence instead of arguing about one number.
shap_panels
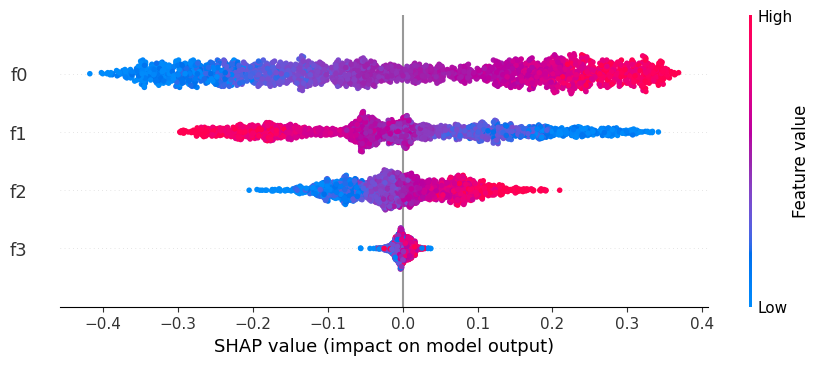
shap_shap_beeswarm
SHAP beeswarm + dependence plots for a small tree model.
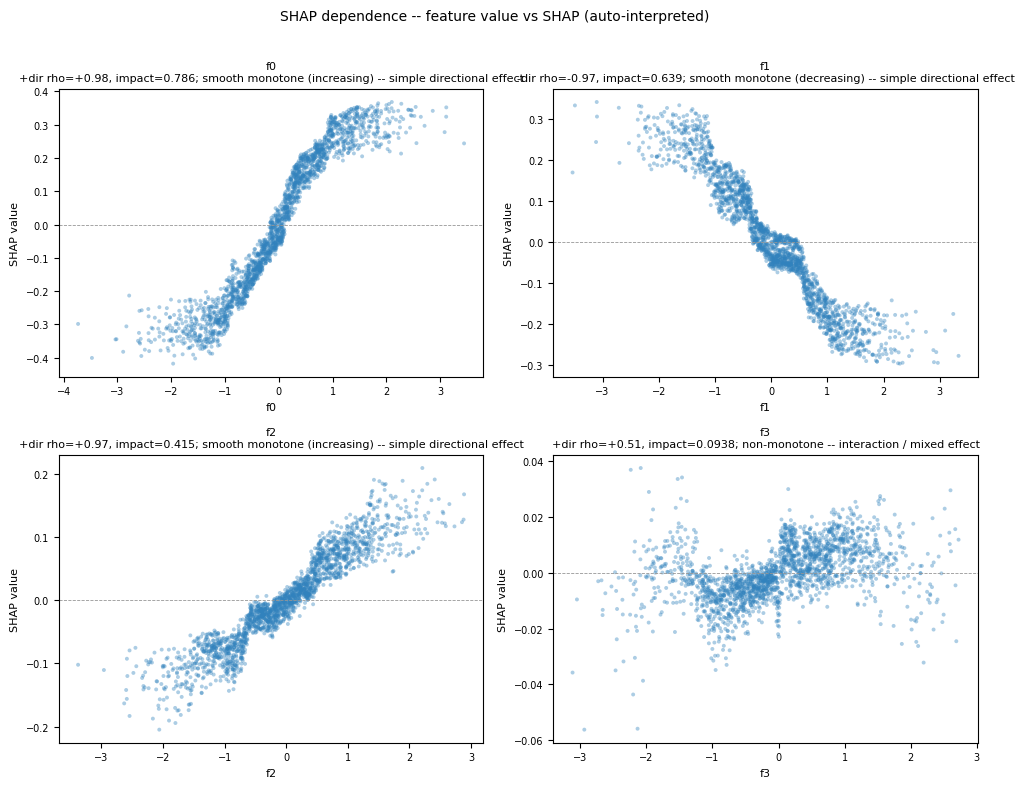
shap_shap_dependence_grid0
SHAP beeswarm + dependence plots for a small tree model.
shap_interactions
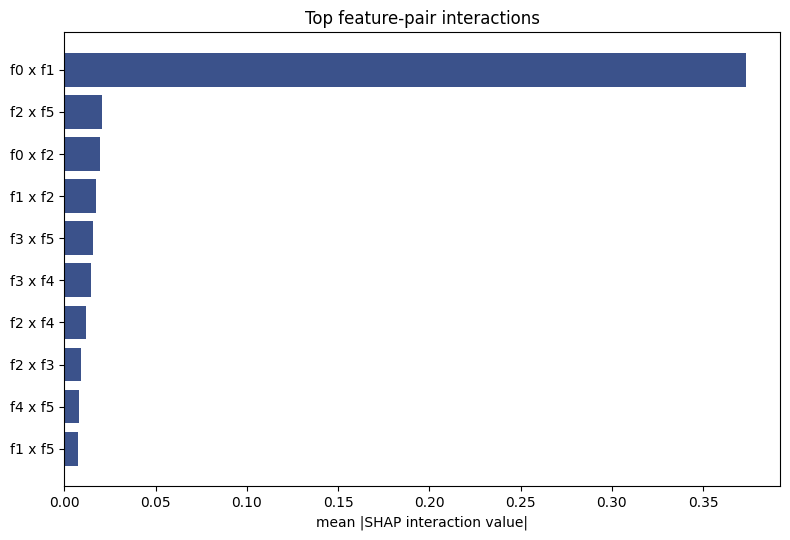
shap_interactions_interaction_top_pairs
SHAP feature-pair interaction summary: top-pairs bar + interaction-strength heatmap.
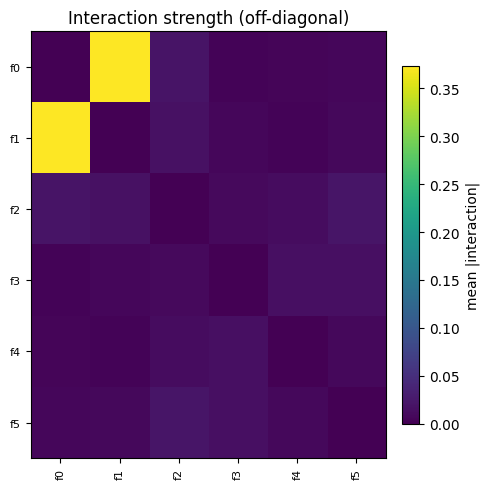
shap_interactions_interaction_heatmap
SHAP feature-pair interaction summary: top-pairs bar + interaction-strength heatmap.
shap_per_instance
shap_per_instance
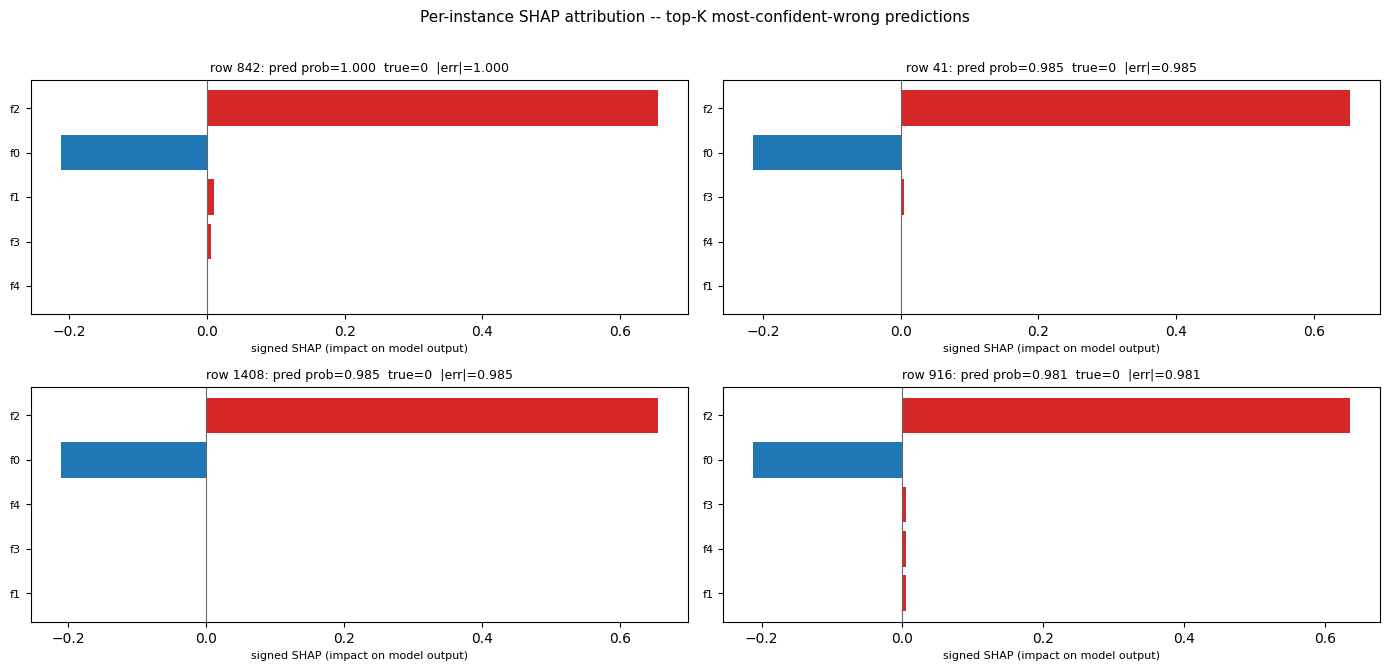
Per-instance SHAP attribution for the top-K most-confident-wrong predictions (signed-SHAP bar per costly error).